2017 Kigurumi Census Results Report
Source Note
This page collates the text, tables, chart descriptions and images of the original report in the Japanese version of the PDF Kigurumi Census Results Report, in the order in which the original report chapter was presented. The original report contained a questionnaire project on adult orientation, sexual experience, sexual orientation, intimate behaviour and personal life; the site was kept as a social history resource and did not represent the position of the station or constitute a behavioural recommendation. The chart image body is not repainted here, and the page retains the description of the chart in the body of the original report and the table data that can be extracted.
| Item | Details |
|---|---|
| Original Japanese title | Kigurumi Census Results Report |
| Author | くっしー (@kussy_tessy) |
| Survey period | About 1 week from 4 October 2017 |
| Responses | 221 answers; exclusion of 1 effective response to 220 replies after the first yes to opt out |
| Original pages | 73 pages |
| Page treatment | By chapter of the original report and embedded in the original report chart |
Title Page
Kigurumi Census Results Report
くっしー (@kussy_tessy)
The results of the “Kigurumi Census”, which took place during about one week from 4 October 2017, are summarized and reported here. A total of 221 responses were collected; of these, one was removed from the list of respondents who chose “not to agree” in the initial question of whether or not to agree, and in the end there were 220 valid answers.
Foreword
Although called “Kigurumi Census”, I would like to emphasize here that it is an investigation conducted by an individual interested in Kigurumi, motivated by a simple personal interest and concern. That is to say, I repeat that this investigation has a great lack of a neutral and impartial perspective, such as the so-called “perspective of God”.
In carrying out the survey, the interest and hobby of producers was criticized as being too evident; it was also pointed out that the parent group itself was biased; and it was said that it was like a seductive question. Exactly. At the end of the day, the survey was not intended for all the men, women and children on Earth who had some interest and interest in Kigurumi. If you do that, 99% of the answers will probably be filled with "not active." It's just through Twitter this narrow medium that makes me feel like the data around me is being collected. My motive was "I want to know what people are like next to me," so I think that's all right with that.
I myself believe that it is impossible to present a unified and universal view of Kigurumi. Even in the academic study of Kigurumi's Keio University, the approach is almost exclusively economic, technical and cultural; the psychological perspective, or the systemic theory of conduct, is still hardly touched upon. It looks like it's taken some of Kigurumi's elements. The fact is that Kigurumi was presented as a specific subject when studying the economy, technology and culture surrounding the royal family. Since it is impossible to establish a unified and universal view of Kigurumi, perhaps the ideal form of the present situation is for everyone to actively engage in “I think so” personal views everywhere, and then lamented, when they were heard, “that thought was still there”.
I think that kigurumi is the cross of many factors, but for everyone, it's different as to what sort of subset kigurumi is. During the discussion at the KMD Forum, someone showed a picture of Kigurumi in the "cosplay" sub-unit, but I think this is just one of many ways of understanding. As far as I understand it, "Girls kigurumi" is more like an intersection between "women's clothes" and "kigurumi"; it's a subset of "cosplay" and it's like an explanation later added in order to explain. To be honest, my actual feeling is closer: I was attracted to something, and then I realized that I didn't know why it was a cosplay, and that I was lucky enough to participate in the cosplay.
If you have any comments on this investigation, I would also like you to do the same. Even I feel that blind faith in this finding is not a good thing in itself (although it's the result of my work, so I believe it). In addition, I have refrained from conducting missions or advocating my views in this investigation. Read the details below, and I'll try to run the data as thoroughly as possible. The first is that the results of the responses are used as material for their own claims and are not the applicable law of the questionnaire. And the second is because I have the feeling that a circle measured with its own ruler can't get out of its shell. One of the questions in the survey, for example, was to let the respondents choose from among the four options the area that they find most attractive to Kigurumi, but this was simply to force everyone to feel the complex charm of Kigurumi into four frameworks. In other words, it is an arbitrary classification. Since it is an investigation conducted with an arbitrary classification and perspective, I do not think it accurately represents the entire circle. Of course, it's not a lie; but, frankly, my heart is broken by organizing the data here. Another point is that the survey was originally conceived and hastily started, not with a view to producing a systematic account of the results.
Nevertheless, when the number of samples exceeds 200, some meaningful tendencies can be observed. And these tendencies are really interesting. What you want to know, what you care about, is here. It is hoped that the survey will be read with pleasure and that some references or findings will be obtained.
1. Gender
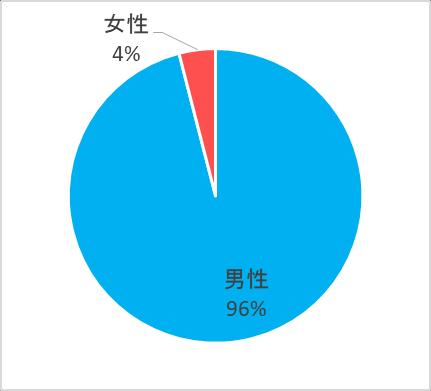
Figure 1 Summary of the sex of 215 valid respondents. Men accounted for 96 per cent, women for 4 per cent, and most of the respondents were men.
Figure 1: Sex of respondents
2. Age
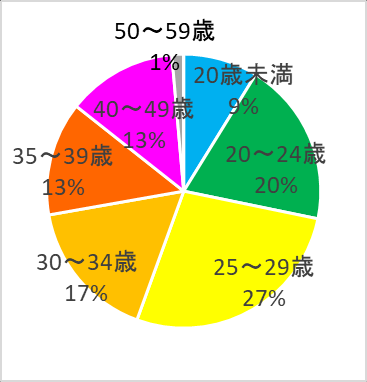
Figure 2 Among respondents, 25-29 years are the highest. The average age is 30 years.
Figure 3 summarizes age composition by region. There are almost no differences between the average age of Kanto, Kansai, Tokai and localities, but there are more people over 40 in Kanto than in other regions. In addition, the average age abroad is 26 years, younger than in Japan and no one over 35.
By type of activity, the average age of “not active” is 24 years, of which about 30 per cent are under 20. The average age of “photography/support” is 37 years, with more than half over 35 years of age.
Figure 2: Age
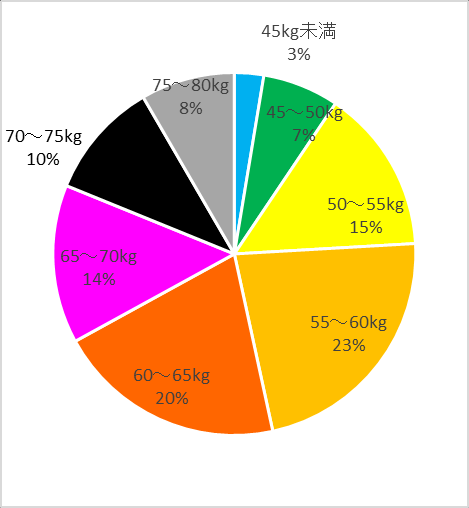 Figure 3: Age composition by region
3. Size
Figure 4 Summarized the height of the respondents. The average height of 217 effective respondents was 170 cm, slightly lower than the average height of 172 cm for men aged 30. There are no significant differences by age. In terms of activity patterns, the comparison of “inside performer” and “support/photography specialty” is 170 cm, “support/photography specialty” is 172 cm and the support specialist is on average 2 cm higher.
Figure 5 summarizes the body weight of respondents. The average body weight of 217 effective respondents was 63kg, which is lower than the average body weight of 30-year-old Japanese male. By activity pattern, the average body weight of respondents to “inside performer” was 63 kg, while those to “photography/support” were 75kg. Most of the “inside performer” age groups are 60-65 kg by age, but the average body weight over 40 years of age is 69kg.
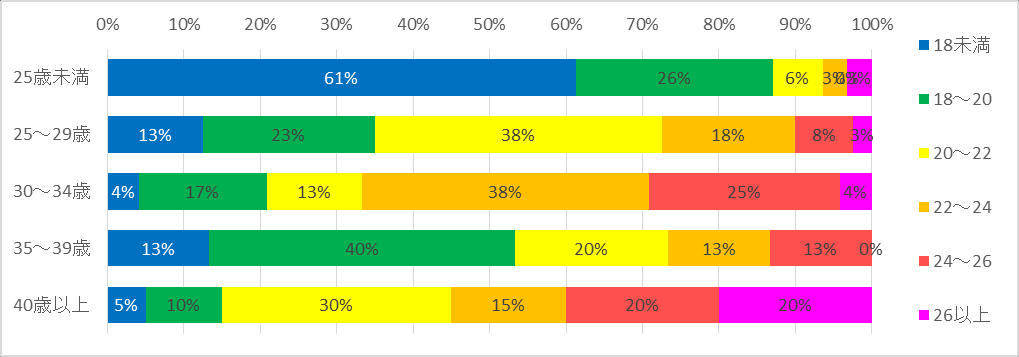
Figure 6 A summary of 185 valid respondents after exclusion of “not known” and “no answers”. The average BMI is 21.5 and is approximately the same as the 22 considered health values. Figure 7 Summary of BMI by age for inside performer. Overall, the older the BMI, the higher. With the exception of 35-39 years. Among persons under 25, 61 per cent of BMIs were under 18, while 40 per cent of those over 40 were above 24.
Figure 4: Height of respondents
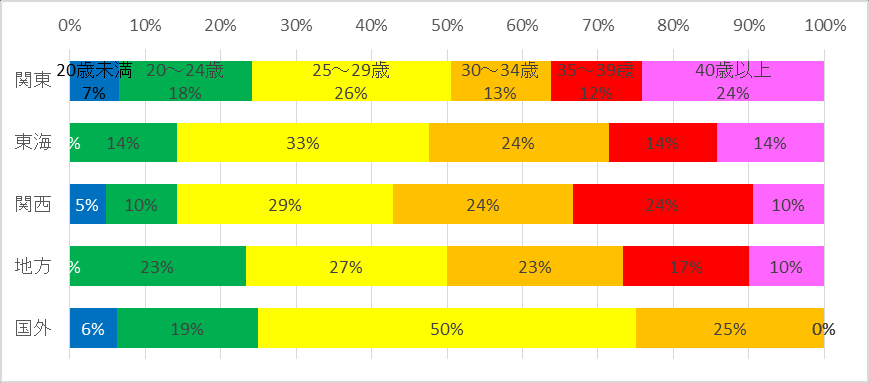 Figure 5: Weight of respondents
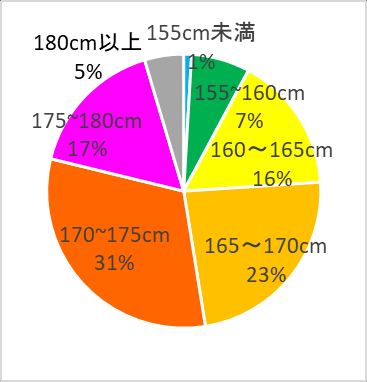 Figure 6: BMI
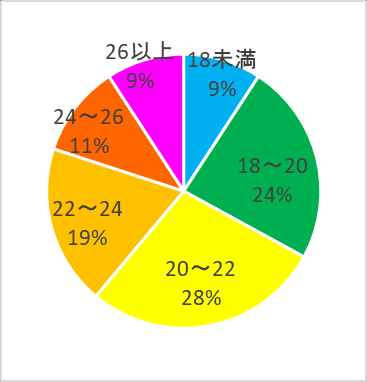 Figure 7: BMI distribution by age of inside performer
4. Place of birth and place of residence
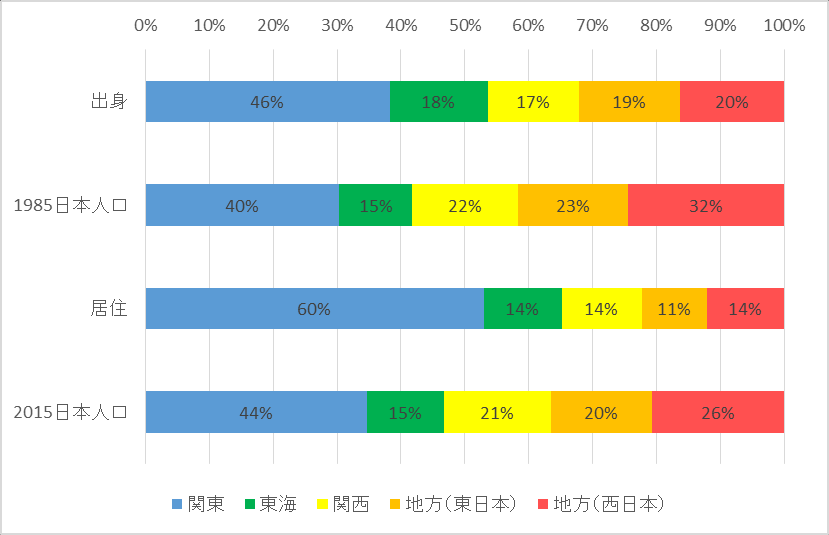
Table 1 Compared to the place of origin and residence, there has been a significant increase in the number of people concerned only in the east and in the rest of the country there has been a general exodus. The following is a combination of “North-East” “North-East” “Shincaku” in Japan, outside Kanto, Donghai and Kansai, into “local” (East Japan) and “neast” “China” “four” “Kyuzhou” in “Northland” into “local (West Japan)”.
Figure 8 Summarizes the distribution of the Japanese population in real census as compared to the population distribution of the respondents to Bigurumi Census. Even compared to 1985 and 2015, about 30 years ago, there was no large-scale movement of the general population; however, this survey clearly shows that many people interested in Kigurumi are coming out of Kansai and the region and going into Kanto. On the other hand, population outflows from the Tokai are not evident.
| Region | Origin | Housing |
|---|---|---|
| Hokkaido. | 8 | 8 |
| Northeast | 13 | 7 |
| Kanto | 75 | 105 |
| Oshinka. | 10 | 5 |
| Tokai | 30 | 24 |
| Northern Land | 5 | 5 |
| Kansai. | 28 | 25 |
| China | 9 | 6 |
| Four countries | 4 | 5 |
| Kyushu | 14 | 8 |
| Overseas | 17 | 17 |
| No answer. | 10 | 8 |
Table 1: Place of birth and place of residence
Figure 8: Comparison of origin, place of residence and population distribution in Japan
5. Occupation and occupation
Figure 9 summarizes the occupations of 213 effective respondents. The largest number of employees in the profession is 55 per cent. The student is 20%. However, this is the full answer statistics, i.e., those who are “inactive/infiltrated”. In terms of activity patterns, about six out of “not active” persons became students and 30 per cent of company employees. The answer to the question “in the event or off would be to wear” “mainly alone”, is 60% for company employees and 10-20% for students.
Table 3 summarizes the job types of 189 valid respondents. The technical category (mechanical/electric) is the largest by job type, followed by IT/SE.
| Occupation | Number |
|---|---|
| Operator/Directorate | 7 |
| Company employees | 118 |
| Civil servants | 9 |
| Self-employment/freedom | 9 |
| Work/freedom | 11 |
| Students/repetitors | 43 |
| Full-time housewife/husband | 0 |
| Jobless | 5 |
| Other | 14 |
| No answer. | 7 |
Table 2: Occupation
| Job type | Number |
|---|---|
| Sales category | 7 |
| Service category | 24 |
| Retail/food | 8 |
| Service category | 11 |
| Advice/financial | 3 |
| IT Category/SE | 25 |
| Technical category (mechanical/electric) | 33 |
| Technical category (construction/civil) | 9 |
| Technical category (chemical/material) | 7 |
| Design class | 4 |
| Transport | 14 |
| Other | 22 |
| Students etc. | 46 |
| No answer. | 10 |
Table 3: Positions
Figure 9: Occupation
6. World composition
Figure 10 shows the composition of 215 effective respondents. 51% live at home, 40% live alone, 10% live with the spouse.
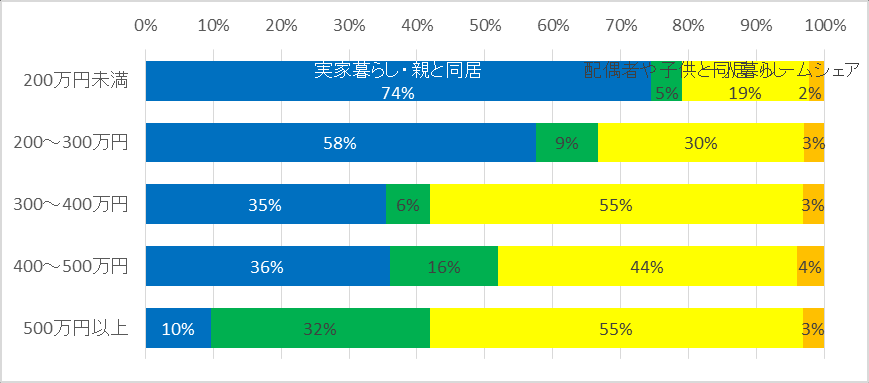
Figure 11 shows the worldly composition of “active” persons by annual income. The higher the income, the higher the proportion of people living alone, the greater the number of people living with their spouses. The proportion of persons with an annual income of less than Yen2 million living at home is 74 per cent and 5 per cent with a spouse; only 10 per cent of those with an annual income of more than Yen5 million live at home and 32 per cent with a spouse. By the way, the age-specific marriage rate in mensus is as follows: 18-24 years 6.0 per cent, 25-29 years 35.9 per cent, 30-34 years 60.9 per cent, 35-39 years 69.7 per cent, 40 years and over 72.4 per cent.
Figure 12 shows the marital status of 217 valid respondents and the number of children. 86% unmarried. The average annual income is 3.2 million yen for those who answer that there are no children and 5.6 million yen for those with children.
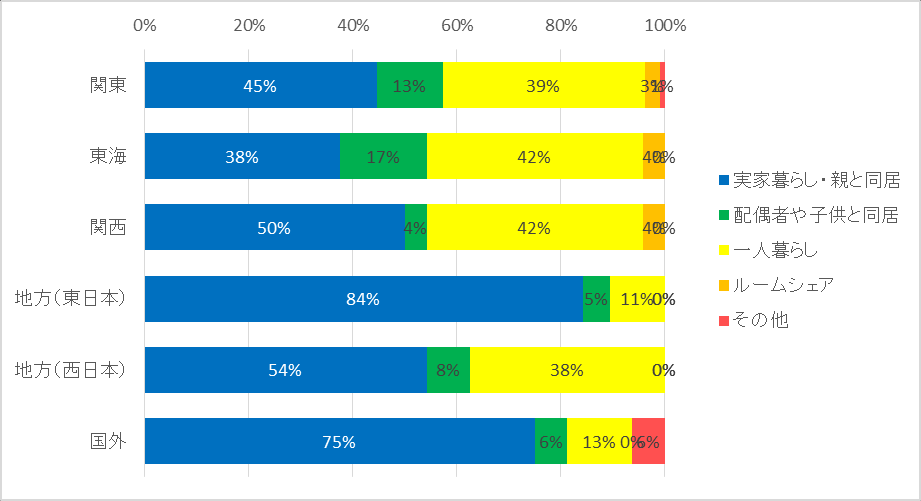
Figure 13 shows the geographical composition of respondents. The proportion of people living in their homes is 38-54 per cent in the three major urban circles and localities (West Japan), and 84 per cent in the localities (East Japan), which is higher. Also, 75% overseas.
In this question, those who choose an answer other than “0 persons (unmarried)” are considered married and the “marriage rate” is calculated by age. Figure 14 shows a comparison of marriage rates between respondents by age and those in real Japanese census. The marriage rate of Kigurumi Census respondents is less than half of the marriage rate in Japan at all ages.
Figure 10: World composition
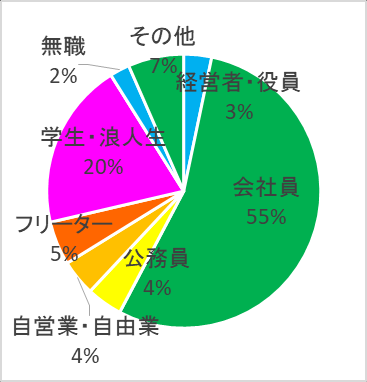 Figure 11: World composition of activists by annual income
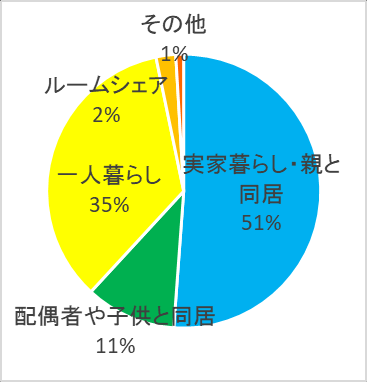 Figure 12: Number of children in activity
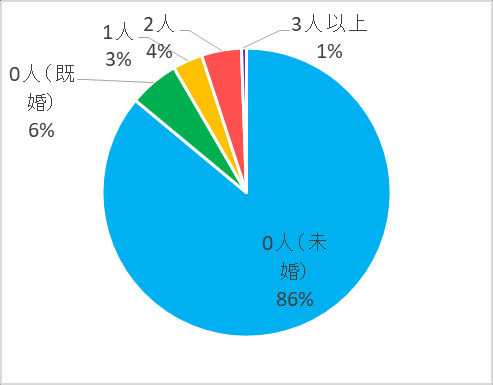 Figure 13: World composition by region
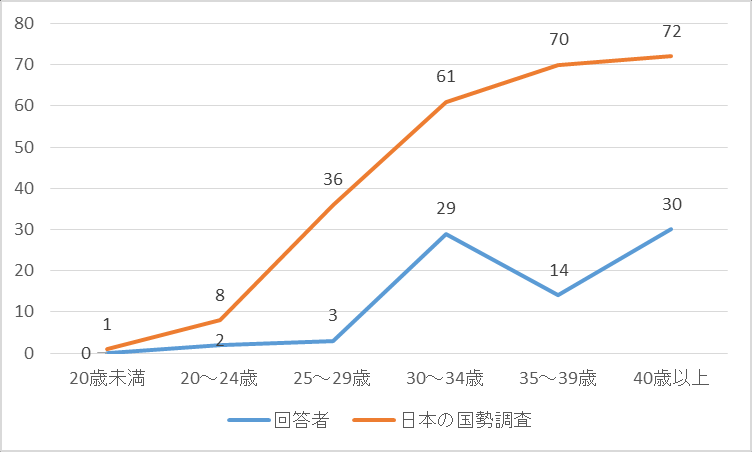 Figure 14: Age-specific marriage rates of respondents compared to the ratio of mensus marriages in Japan
7. Annual income
Figure 15 shows the annual income of 190 valid respondents. The most common area is under 2 million yen, and about half is under 3 million yen. The average annual income of the respondents was 3.5 million yen, while the average annual income of the 165 persons in activity-only activities was 3.6 million yen, and the average annual income of those with at least one face was 3.7 million yen. However, the statistics include students. Figure 16 shows annual income after exclusion. The most common area was moved to 2-3 million yen, with an average annual income of 3.9 million yen.
Figure 17 shows the distribution of annual income by region among “active” persons. The average annual income is 3.8 million yen in Kanto, 4.2 million yen in the Tokai, 4.2 million yen in Kansai, 2.2 million yen in the local (East Japan) and 2.9 million yen (including students) in the local (West Japan).
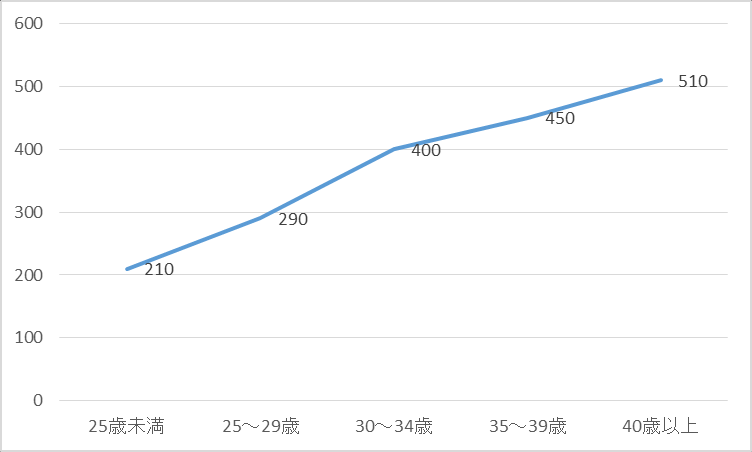
Figure 18 shows the distribution of annual income by age among active persons, and figure 19 shows changes in average annual income by age. The average annual income rises with age, from 2.1 million yen under 25 to 5.1 million yen over 40 years of age; however, the median annual income remains about 4 million yen after 30 years.
Figure 15: Annual income
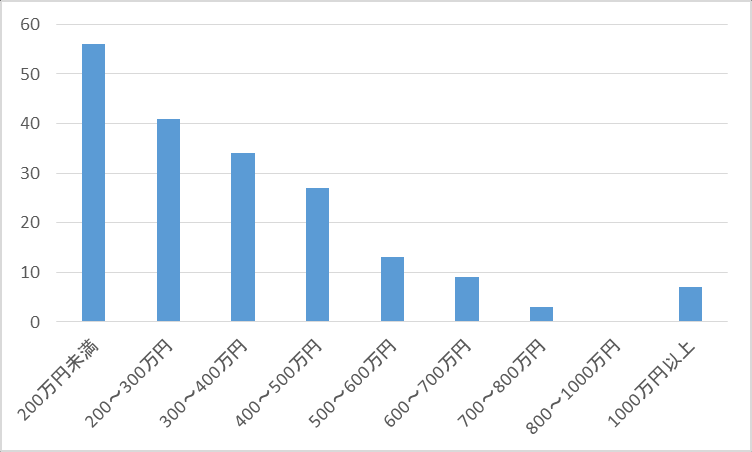 Figure 16: Annual income (exclusion of students)
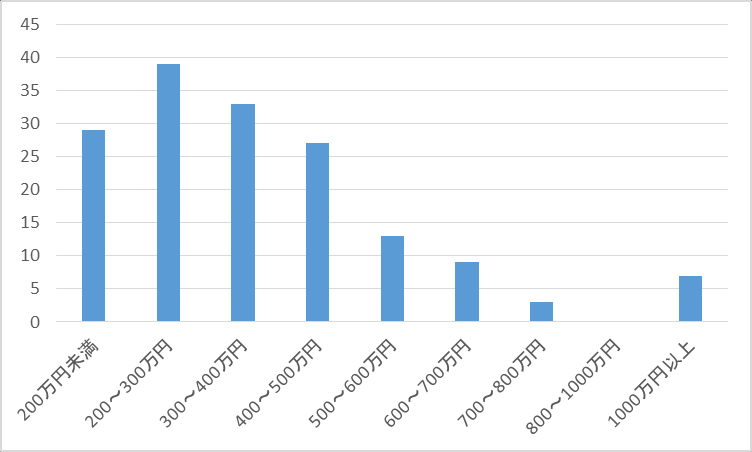 Figure 17: Distribution of annual income by region
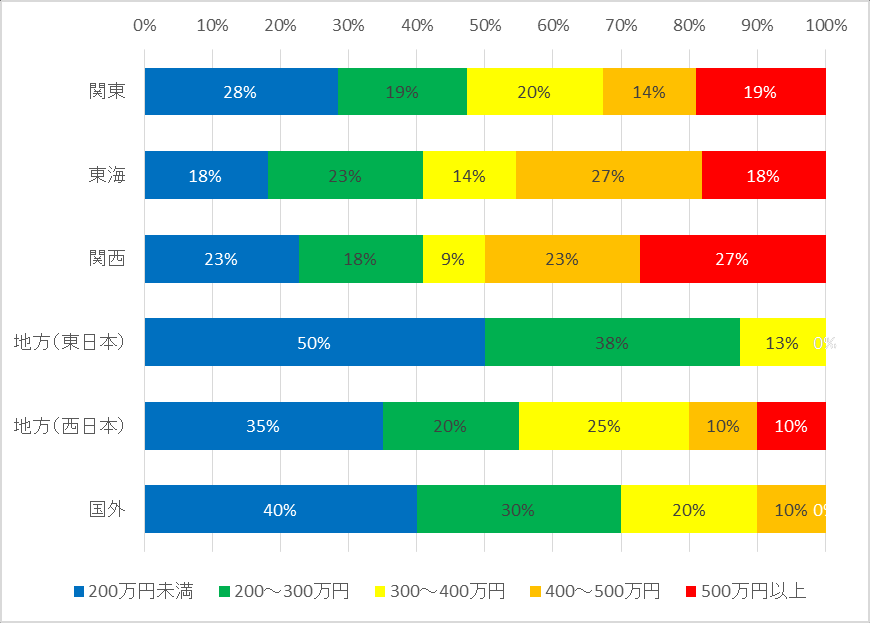 Figure 18: Distribution of annual income by age
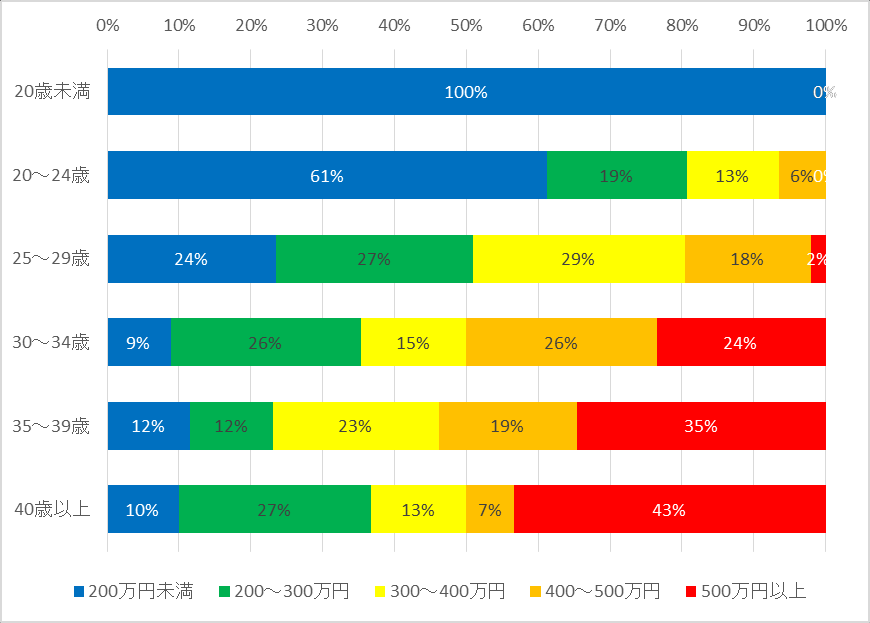 Figure 19: Age-specific changes in the average annual income of active persons
8. Education
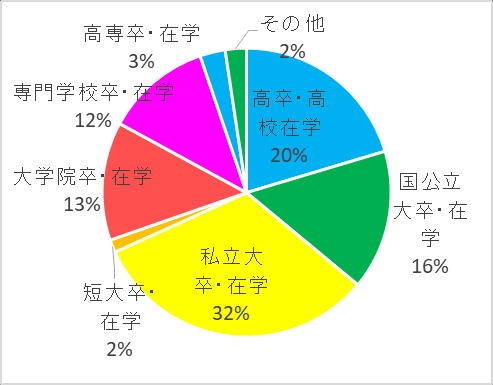
Figure 20 Summary of education/attendance of 211 valid respondents. The total number of university or university graduates and graduate or postgraduate graduates is 63 per cent. As it includes students, figure 21 shows the degree of graduation after exclusion. Graduates graduated 14 per cent and universities 45 per cent. One third of university graduates are State-run universities. High school graduates are 19%.
Figure 20: Education/attendance
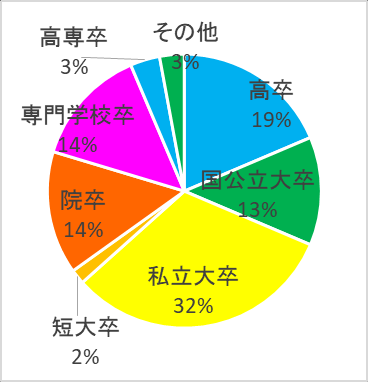 Figure 21: Education (exclusion of students)
9. Pattern of activity
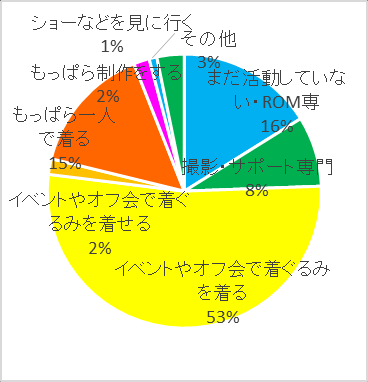
Figure 22 summarizes the pattern of activities of 217 valid respondents. Fifty-three percent of the answer was, "In the event or off, kigurumi will be dressed," and 15 percent of the answer was, "Mostly alone." This survey combines the two into “inside performer”. In addition, the number of “not yet active/ROM specialized” is 16 per cent. The selection of an alternative is treated as “active”.
Figure 22: Pattern of activities
10. Length of activities
Figure 23 Summarizes the years of activity of 216 valid respondents. “Not yet active” is 19 per cent; even if this part is removed, the majority is less than 5 years. In addition, it was 6 per cent for more than 15 years. The average length of activity is 5.9 years.
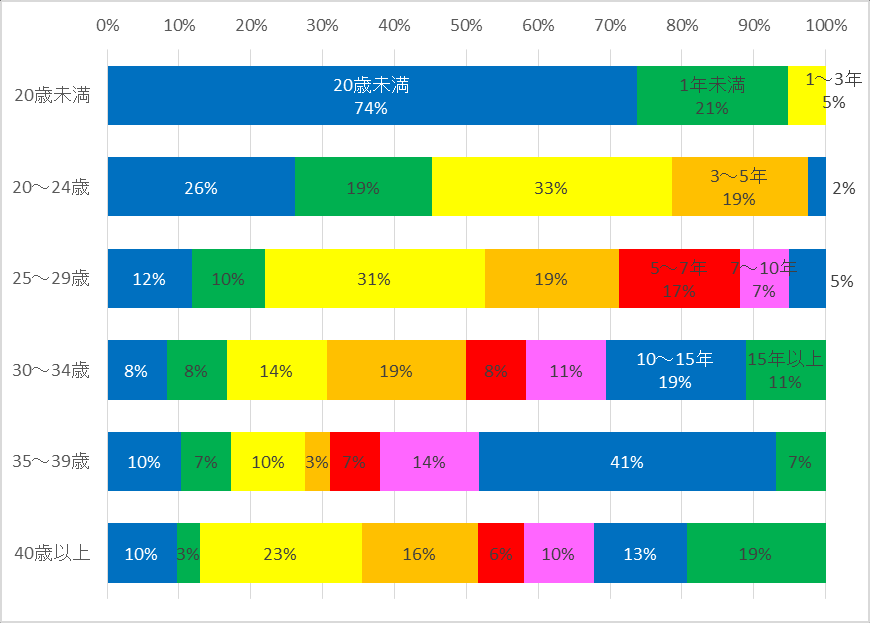
Figure 24 shows the years of activity by age. Of those under 20, 74 per cent are “not active”. A majority of those aged 20-24 have been active for more than one year; 48 per cent of those aged 35-39 have had more than 10 years of activity. Of the 40 years and older, 19 per cent had more than 15 years of activity, but nearly 40 per cent had less than 3 years. In the case of activity-only persons, the average activity years are: 25 years under 2.4 years, 25-29 years 4.2 years, 30-34 years 7.5 years, 35-39 years 9.3 years, 40 years over 8.0 years.
Figure 23: Length of activities
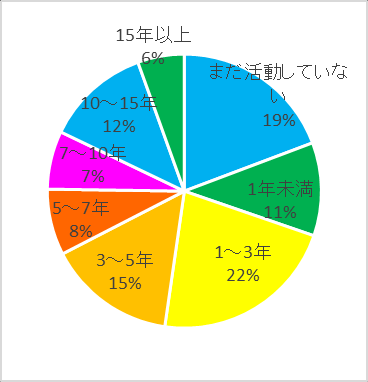 Figure 24: Age distribution of activities
11. Period of ambush
Figure 25 Summary of the period of ambush for 215 effective respondents. For only 175 activists, the average latency period is 5.1 years. However, 18 per cent of those who have not yet started a year and 15 per cent of those who have been in hiding for more than 10 years can see a significant difference in the duration of the ambush.
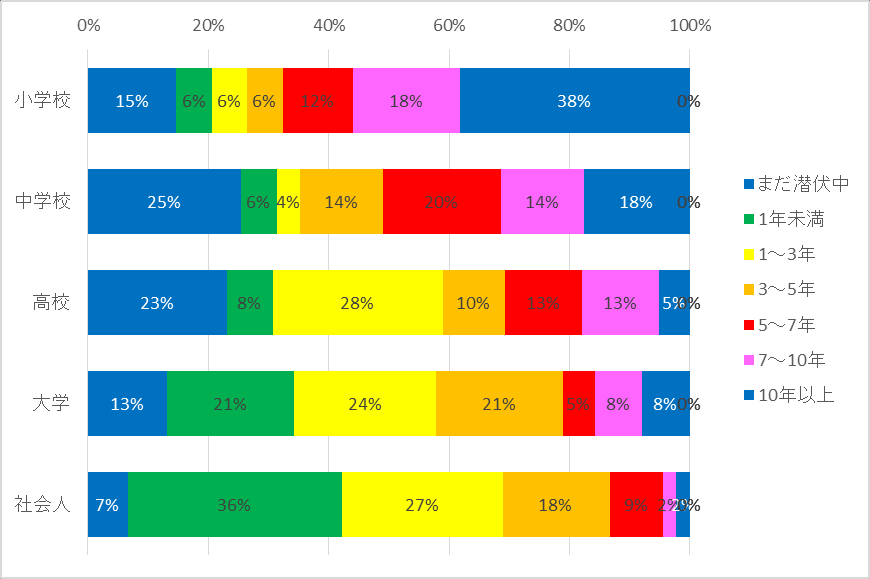
Figure 26 Summary of the period of latency by period of interest. The sooner you get interested, the longer you sleep. If there is an interest in becoming a social person, 36% of the population starts kigurumi in less than a year.
Figure 25: Period of latency
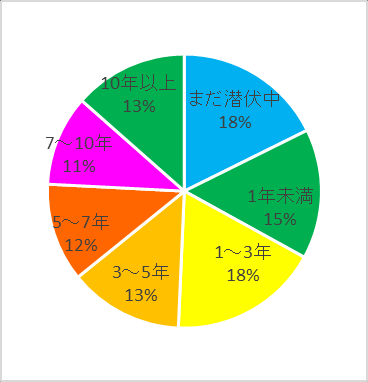 Figure 26: Vacuum periods by period of interest
12. Initial target period for the lurch
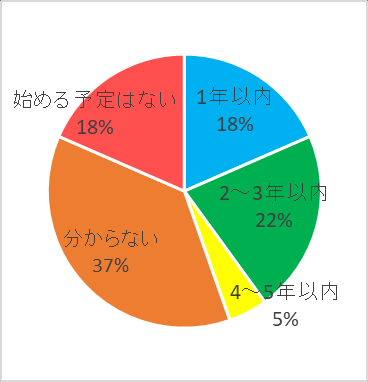
Figure 27 shows the time period during which 65 people who responded that they were sleeping were scheduled to start their activities. Forty percent of the responses are scheduled to start activities within three years. On the other hand, “not knowing” accounted for 37 per cent. The answer to “no start plan” was also 18%.
Figure 27: Beginning of the activity of the sleeper
13. Possession of Hada-tai
Figure 28 shows the number of Hada-tai items owned by 183 active respondents. 51% own more than three. The average holdings were: 3.0 for active persons and 3.1 for inside performer persons.
Figure 29 Summarizes the share of Hada-tai supply sources. Today it is 40%, 27%.
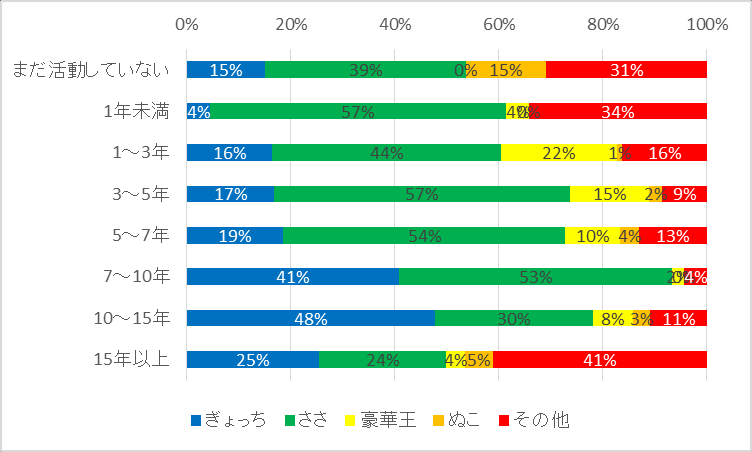
Table 4 shows the number of Hada-tai possessions and the composition of supply sources by year of activity. The longer the activity lasts, the more the Hada-tai have. The average number of possessions is 1.75 for persons under one year and 5.58 for persons over 15 years. Figure 30 shows the share of supply sources by year of activity. After 7 years of activity, which is now in the vanguard, it is now in balance with or in the vanguard.
| Length of activities | Zenium | Tonight. | The luxurious king. | Zenium | Other | Total |
|---|---|---|---|---|---|---|
| Not active yet | 0.06 | 0.16 | 0.00 | 0.06 | 0.13 | 0.42 |
| Less than 1 year | 0.08 | 1.00 | 0.08 | 0.00 | 0.60 | 1.75 |
| 1-3 years | 0.49 | 1.31 | 0.67 | 0.03 | 0.49 | 2.98 |
| 3-5 years | 0.62 | 2.10 | 0.56 | 0.09 | 0.32 | 3.68 |
| 5-7 years | 0.63 | 1.82 | 0.35 | 0.13 | 0.44 | 3.36 |
| 7-10 years | 1.83 | 2.36 | 0.10 | 0.00 | 0.20 | 4.50 |
| 10-15 years | 1.91 | 1.22 | 0.30 | 0.14 | 0.43 | 4.00 |
| More than 15 years | 1.42 | 1.36 | 0.20 | 0.30 | 2.30 | 5.58 |
Table 4: Average number of Hada-tai owned items per person by length of activity and composition of source of supply
Figure 28: Hasa-tai owned by activists
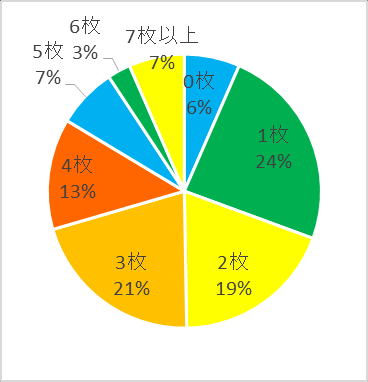 Figure 29: Share of supply sources of Hada-tai
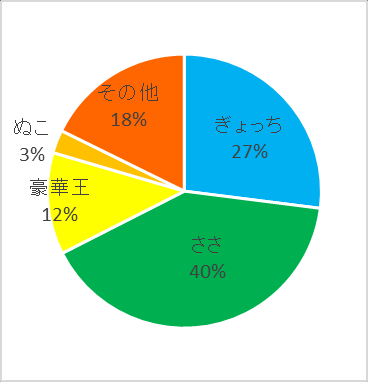 Figure 30: Share of Hada-tai supply by length of activity
14. Face ownership
Figure 31 Summary of the number of valid respondents in 183 activities. It should be noted that a number of people are also visible who are “divide” but already have a face; however, as long as they are “not active” in the form of activity, they are not counted as “activists”, whether or not they have a face. The average number of valid respondents per person is 2.8. For “activists”, the nominal number per person is 3.8.
Figure 32 summarizes the holdings by annual income. Some 40 per cent of those with an annual income of less than Yen2 million have only less than 1 face, while only about 20 per cent of those with an income below 1 million yen. However, since then, with the increase in annual income, only those with less than 1 body and those with more than 7 bodies have increased, and the number of persons with 3-6 bodies has decreased, indicating “bipolar” behaviour. Thus, as shown in figure 33, per capita ownership is less than 2.50 bodies when the annual income of 2 million yen is less, but about 4 bodies when the annual income is over 2 million yen, largely independent of annual income.
Figure 34 shows the distribution of ownership by year of activity, and figure 35 summarizes the average ownership by year of activity. By 3-5 years, the longer the activity is, the more the number of surfaces; by 10-15 years, around 4.5; and by more than 15 years, a significant increase to 7.30.
Figure 36 shows the share of the supply sources of all 581 body kigurumi units that received an effective response, and table 5 shows the nominal numbers by source of supply. The share is 28 per cent, 19 per cent (15 per cent, 4 per cent), 7 per cent, and more than half of the top three. (Note: Responses also include overseas responses.
Table 6 summarizes the per capita ownership of the top five houses by year of activity. Figure 37 further summarizes its share composition. There is a tendency to increase the share in relation to the length of activity: up to 20 per cent in 7 years and up to 40 per cent in 7. The largest number of years of activity in the years 1-3 was 25 per cent, with a decline of over 10 years and 1 per cent over 15 years. The proportion of persons under 1 year of age is 27 per cent, but the length of the activity is decreasing to 0 per cent for more than 15 years.
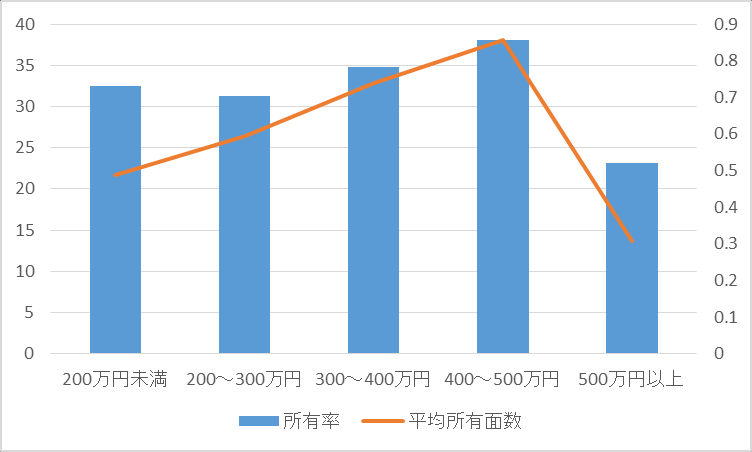
An annual income survey of the ratio of each building to the average number of surfaces shows a clear preference for both tungsten and tungsten (self-employed). Figure 38 shows the dependency of the ownership and average ownership on annual income. Figure 39 shows the dependency of the ownership and average ownership on annual income. The construction houses show a tendency to have more facets than the higher the annual income; on the other hand, the ownership rate and the average ownership number are on the upward trend between the annual (self-employed) income and 5 million yen, but after the annual income exceeds 5 million yen, both ownership and the average ownership number have declined. However, this is also likely to be the result of a false link to the length of the activity (the longer the activity is, the older it is, the higher the annual income). Thus, when the average number of nominals is calculated for persons with an active life of less than 5 years, it is: 2 million yen under 0.26 body, 2-3 million yen under 0.71 body, 3-4 million yen under 0.83 body, 4-5 million yen over 0.25 million body over 1.00 body; although 4-5 million yen has not followed the trend, it is generally possible to recognize dependence on annual income. Self-acting: 2 million yen under 0.48 body, 2-3 million yen under 0.79 body, 3-4 million yen under 0.75 body, 4-5 million yen under 1.08 body over 5 million yen under 0.33 body, can also confirm similar annual income dependency.
| Workspace name | Number |
|---|---|
| Zenium | 161 |
| I'll do it myself. | 85 |
| Zenium | 42 |
| Handcuff. | 35 |
| The luxurious king. | 34 |
| You bastard! | 32 |
| The commission. | 24 |
| RINS | 22 |
| See ya. | 19 |
| Oh, my God. | 16 |
| Ray's workshop. | 15 |
| Zenium | 15 |
| Zenium | 5 |
| Other domestic | 56 |
| Other overseas | 20 |
Table 5: Source of supply of kigurumi
| Length of activities | Zenium | I'll do it myself. | Zenium | Handcuff. | The luxurious king. |
|---|---|---|---|---|---|
| Less than 1 year | 0.10 | 0.15 | 0.30 | 0.00 | 0.05 |
| 1-3 years | 0.30 | 0.60 | 0.30 | 0.17 | 0.35 |
| 3-5 years | 1.10 | 0.83 | 0.38 | 0.48 | 0.45 |
| 5-7 years | 0.73 | 0.47 | 0.40 | 0.20 | 0.00 |
| 7-10 years | 1.93 | 0.80 | 0.20 | 0.07 | 0.07 |
| 10-15 years | 1.27 | 0.32 | 0.09 | 0.27 | 0.14 |
| More than 15 years | 3.18 | 0.09 | 0.00 | 0.27 | 0.00 |
Table 6: Average kigurumi supply sources per person by year of activity
Figure 31: Number of active participants
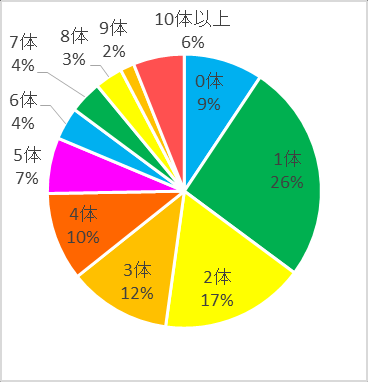 Figure 32: Distribution of owners by year of income
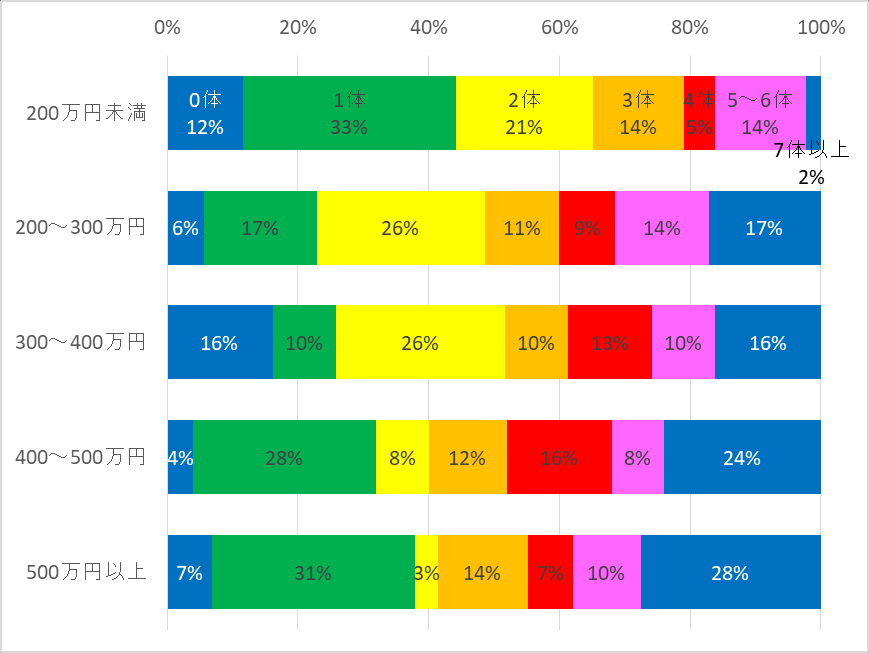 Figure 33 Per capita ownership by activity, by annual income
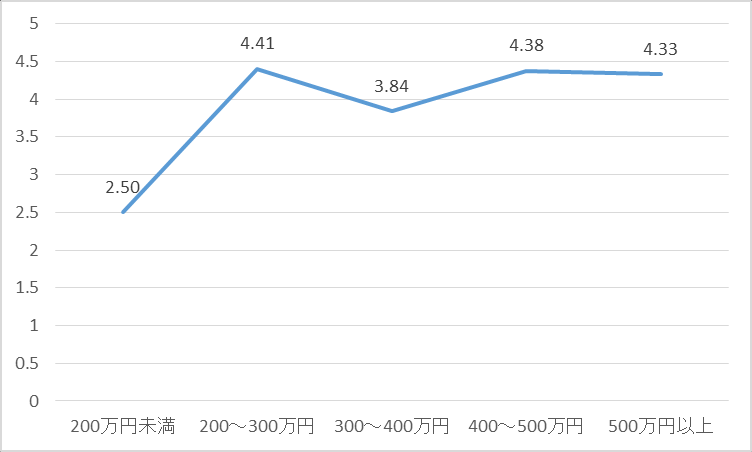 Figure 34 Distribution of holdings by year of activity
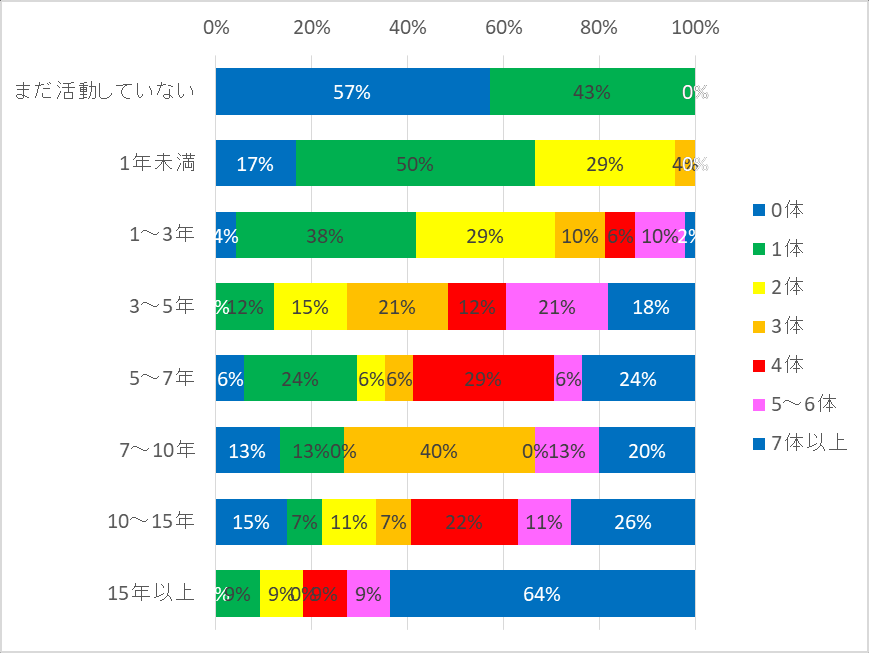 Figure 35 Per capita ownership by year of activity
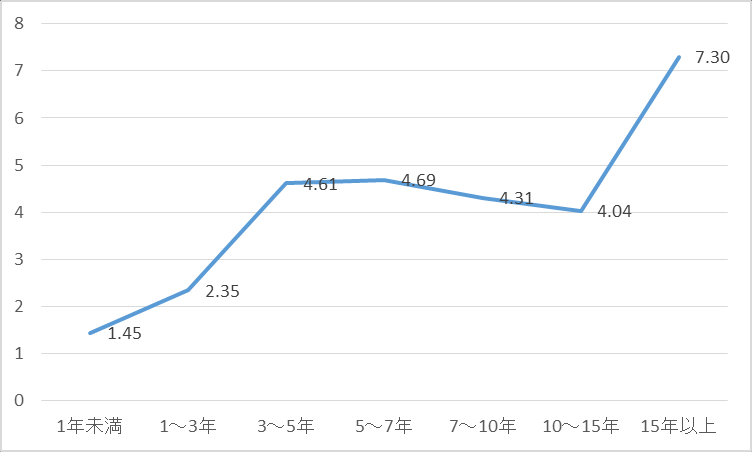 Figure 36: Share of housing supply sources
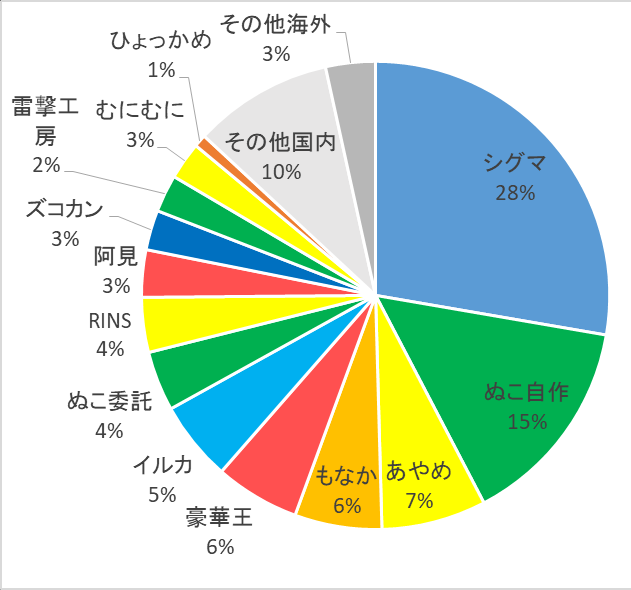 Figure 37 Composition of kigurumi supply sources by length of activity
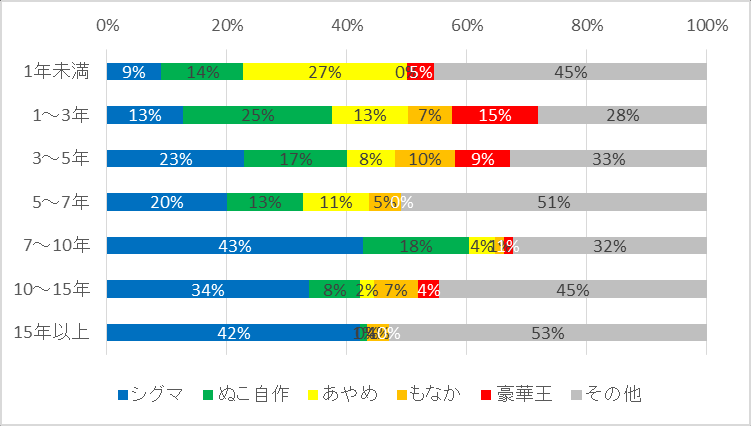 Figure 38: Perceived ownership by annual income and average
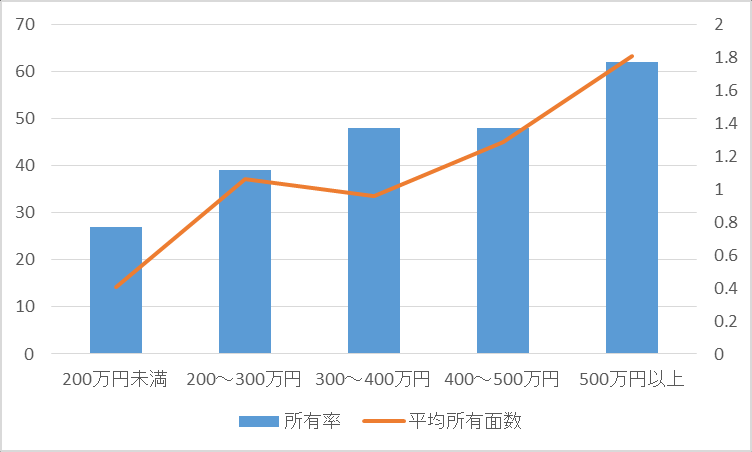 Figure 39: Spectacular (self-employed) ownership by annual income and average ownership
15. The opportunity to know Kigurumi's favorite.
Figure 40 summarizes the opportunities for 214 effective respondents to know Kigurumi's hobby. Sixty-nine percent of them said, "See on the Internet."
Figure 41 summarizes the opportunities for knowing Kigurumi ' s preferences by year of activity. In general, “seeing on the Internet” is more than 60 per cent of any activity age group; however, the proportion fell to 45 per cent in more than 15 years, while the answer to “see in show” was 27 per cent, higher than that for all other activities. In addition, neither of the two answers “seen in a cosplay event” “knows that a friend knows someone” has been made, nor has one of them for more than 15 years.
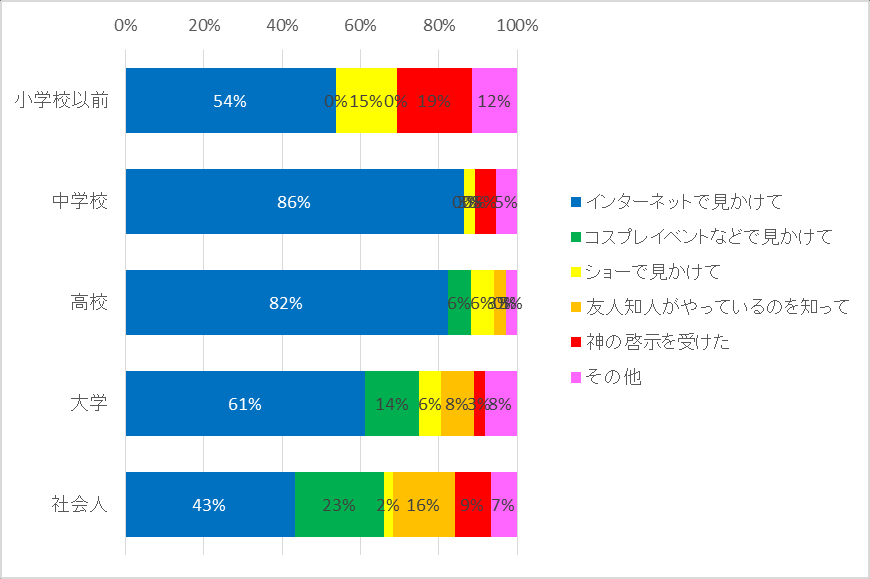
Figure 42 summarizes the opportunities for knowing Kigurumi ' s preferences by awakening period. At any point in time, “see on the Internet” is still dominant; but among those who awoke before primary school, there were a little more “see in show” and “enlightened by joke options”; among those who awoke at the social stage, “see in cosplay activities” were more “know that friends know people who do”.
Figure 40: Knowing Kigurumi's favorite opportunities
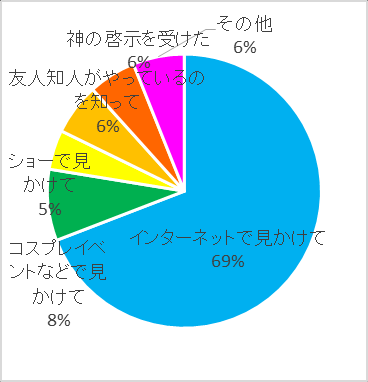 Figure 41: Opportunities for knowing Kigurumi ' s hobby by length of activity
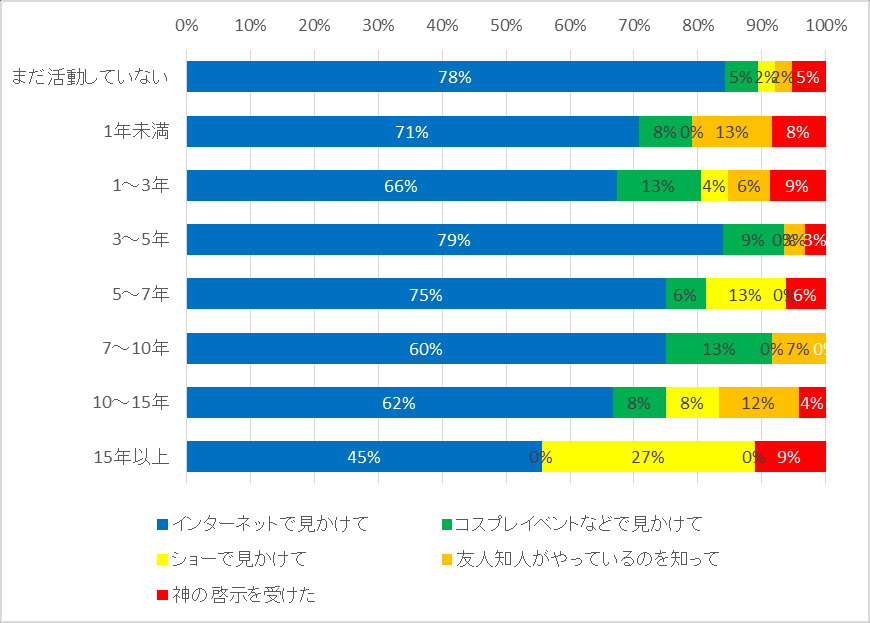 Figure 42: Opportunities to know Kigurumi's preferences by awakening period
16. How to open the door in circles
Figure 43 Summarizes the approach of the activists to the opening of the kigurumi industry. The largest number is “Assessed/produced first in all”, 40 per cent. “Presponsible interview” is 20% and “by someone else” 15%. There are also 17% people who “can't remember”.
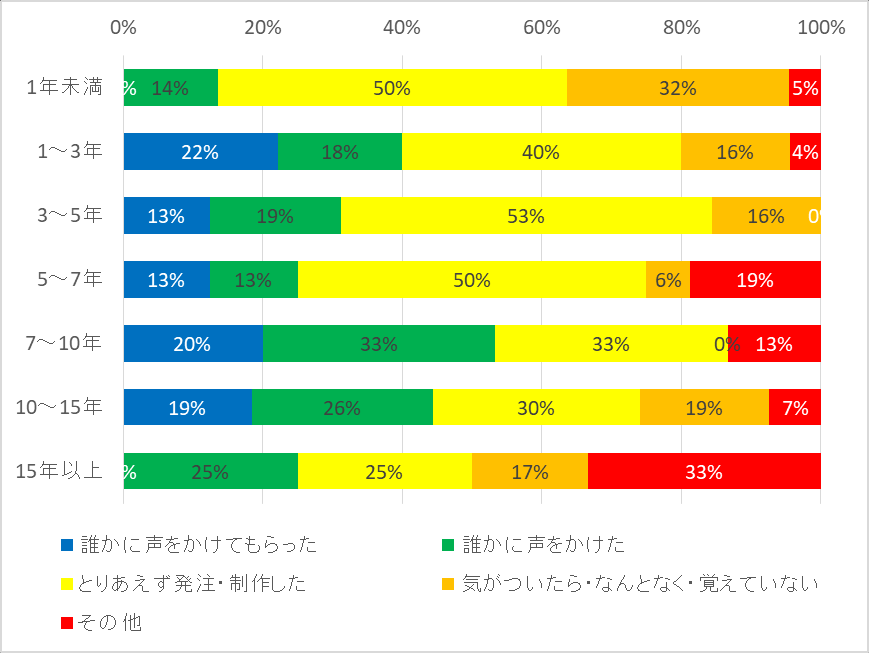
Figure 44 Summarizes the method of probity by year of activity. As can be seen, for those below seven years, the “overall apostilles/productions” dominate by about 50 per cent; after seven years the proportion drops to about 30 per cent, while the “active talk-seeking” is about 30 per cent, with a slight advantage. Among those over 15 years, “others” provided the most answers.
Figure 43: Method of opening the door by the actors
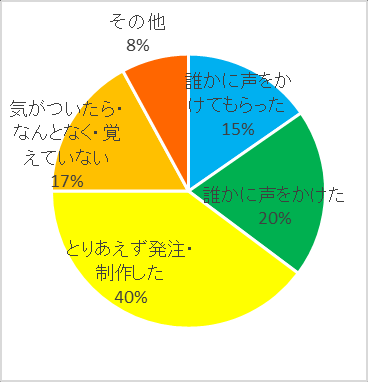 Figure 44: Method of bowing by length of activity
17. Frequency of Kigurumi activities
Figure 45 shows the frequency distribution of Kigurumi activities among “activists”, and table 7 shows the average frequency (unit: number/person/year). "On its own" is the largest activity, over 50% at least once a month. "Participation in off meetings" also exceeds 50 per cent and at least once every 2-3 months. “The more closed activities” “Cosplay in the street” “Scene or outdoor photography” “Scene or outdoor photography” “Scientific or indoor photography” “Explorations above 200 km” are more than 50 per cent more than 50 per cent at least once a year and 20 per cent more than every 2-3 months. On the other hand, about 30 to 40 per cent of the people have never carried out these activities. Fewer people participate in “extremely closed activities like H”, with 77 per cent never taking part. There are also fewer people doing "creative activities" and 65 percent never did.
Figure 46 summarizes the frequency of Kigurumi activities by region. “Overseas” is active in many projects. Turning to the domestic context of Japan, there is little difference between the city and the local level in “single clothes”, but there are significant local differences in many projects. Here, the mean frequency (Kanto, Donghai, Kansai) is defined as the “local gap” by dividing the average frequency (local East Japan, local West Japan). Off would be about 3-4 times, and the photography would be about 5-6 times. The Tokai is the largest of the “off meetings with kigurumi”, about once a month; the locals are about half a year. In the absence of kigurumi's off-the-job meeting (imagined as a BBQ or a drinking party), Kansai became more prominent, once a month. Even with "H" and other closed activities, Kansai is more numerous, averaging about three months; it is almost non-existent. There are also more activities like “sales fairs” in Kansai. The Tokai and Kansai, on average, are more numerous in the “cosplay activities” east of the street, with an average of about four months; at the local level, local (Western Japan) attend more frequently than Kanto, while in East Japan it is rare, about two years ago. The “Faceground or Outdoor Photography” “Choose or Indoor Photography” is also more common in the Tokai and Kansai and is relatively low. Of the “200km or more expeditions”, Kansai has the largest number, more than once a month; it stays at about half a year. “Creative activity” is also active in the Tokai and Kansai. Moreover, in all projects, overseas activities are carried out at a frequency comparable to or greater than the three major urban centres in Japan.
However, in the above-mentioned comparison, as long as one person attends HF, the average is significantly higher (particularly with a small number outside Kanto) and therefore not necessarily correctly compared. For this purpose, using the “biannual” basis, table 8 summarizes the proportion of people living in their places of residence who carry out activities with the above frequency.
| Activities | Frequency of activity (second/person/year) |
|---|---|
| And wear it alone. | 15.0 |
| Participation in off meetings | 7.0 |
| No kigurumi off meeting | 5.9 |
| Activities like H | 1.5 |
| Activities such as sale fairs | 2.7 |
| Street cosplay activity | 2.6 |
| Exterior or outdoor photography | 2.8 |
| Studio or indoor photo fair | 2.9 |
| 200 km and above expedition | 4.0 |
| Creative activities | 3.8 |
Table 7: Average kigurumi activity frequency per person
| Activities | Kanto | Tokai | Kansai. | Local (East Japan) | Local (West Japan) | Overseas |
|---|---|---|---|---|---|---|
| And wear it alone. | 84 | 85 | 88 | 67 | 88 | 100 |
| Participation in off meetings | 66 | 81 | 90 | 58 | 47 | 63 |
| No kigurumi off meeting | 47 | 75 | 67 | 33 | 44 | 60 |
| Activities like H | 8 | 5 | 11 | 0 | 6 | 23 |
| Activities such as sale fairs | 49 | 52 | 19 | 25 | 6 | 38 |
| Street cosplay activity | 35 | 45 | 50 | 9 | 35 | 43 |
| Exterior or outdoor photography | 35 | 53 | 55 | 8 | 24 | 64 |
| Studio or indoor photo fair | 31 | 45 | 33 | 9 | 24 | 79 |
| 200 km and above expedition | 38 | 57 | 62 | 25 | 38 | 36 |
| Creative activities | 10 | 28 | 47 | 9 | 13 | 17 |
Table 8: Proportion of people who perform this activity at least once a year, by region (%)
Figure 47 summarizes the degree of pride in Kigurumi ' s hobby in relation to the frequency of Kigurumi ' s activities. The more proud they are, the more they participate in the streets, the more they participate in the scenery or outdoor photography, the more frequent they travel, the less they participate in closed events such as the デパH. On the other hand, the frequency of off meetings, i.e. fairs, indoor photo fairs is not much related to the pride of Kigurumi. The higher the pride, the higher the person who wears it alone, the higher the person who has no pride at all.
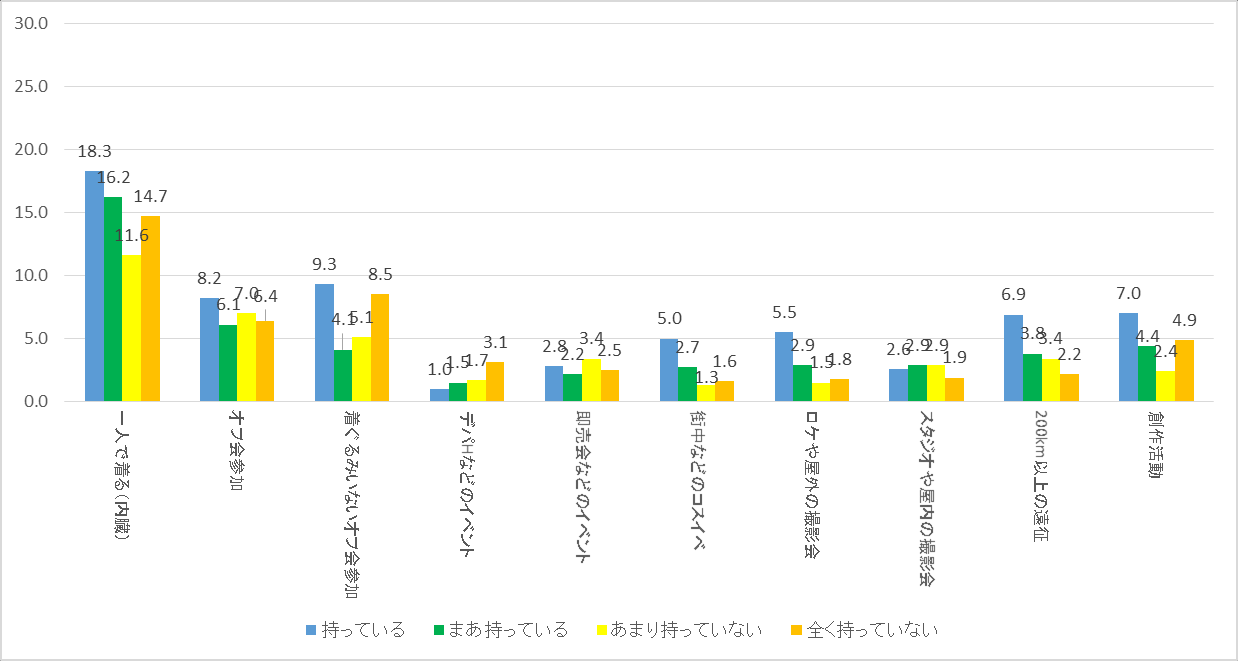
Table 9 summarizes the frequency of Kigurumi activities by child. There is almost no difference in the frequency of wearing alone; however, there is a difference between 7.4 times/year for those without children and 4.4 times/year for those with children. On the other hand, the frequency of participation in cosplay activities in the street is reversed, with 2.5 times/persons per year for those without children, 3.9 times/persons per year for those with children and more frequently for those with children.
Table 10 summarizes the frequency of activities by the degree of sexual excitation of kigurumi. In almost all projects, the more sexually excited people are at Kigurumi, the more frequent the Kigurumi activities. The difference is most evident in “separately dressed”: 16.6 times/year for those who produce sexual excitement, compared to 6.2 times/year for those who do not. It's more frequent for kigurumi sex excites to participate off. The frequency of participation in a “cosplay in the street” is not the highest for “generation”, but for “how much generation”. There's no kigurumi off going to frequency on whether or not to be sexually excited. The frequency of “participation in closed activities such as “H” is not the highest for “generation”, but for “how much generation”.
| Activities | No children | With children |
|---|---|---|
| And wear it alone. | 15.0 | 16.5 |
| Participation in off meetings | 7.4 | 4.4 |
| No kigurumi off meeting | 6.2 | 3.8 |
| Activities like H | 1.3 | 0.7 |
| Activities such as sale fairs | 2.8 | 1.7 |
| Street cosplay activity | 2.5 | 3.9 |
| Exterior or outdoor photography | 2.8 | 2.8 |
| Studio or indoor photo fair | 2.8 | 3.4 |
| 200 km and above expedition | 4.0 | 4.6 |
| Creative activities | 3.7 | 4.5 |
Table 9: Frequency of Kigurumi ' s activities by child
| Activities | Generate | How much? | Not produced/not produced |
|---|---|---|---|
| And wear it alone. | 16.6 | 12.5 | 6.2 |
| Participation in off meetings | 8.1 | 5.5 | 3.0 |
| No kigurumi off meeting | 6.0 | 5.8 | 6.3 |
| Activities like H | 1.6 | 2.3 | 0.1 |
| Activities such as sale fairs | 3.0 | 2.5 | 1.7 |
| Street cosplay activity | 2.5 | 3.5 | 0.8 |
| Exterior or outdoor photography | 3.0 | 2.9 | 1.1 |
| Studio or indoor photo fair | 3.3 | 2.1 | 2.2 |
| 200 km and above expedition | 3.6 | 4.7 | 2.6 |
| Creative activities | 3.5 | 5.0 | 0.0 |
Table 10: Frequency of activities by degree of sexual excitation to Kigurumi
In addition, the frequency of Kigurumi activities does not differ significantly between the years of activity.
Figure 45: Frequency of Kigurumi ' s activities
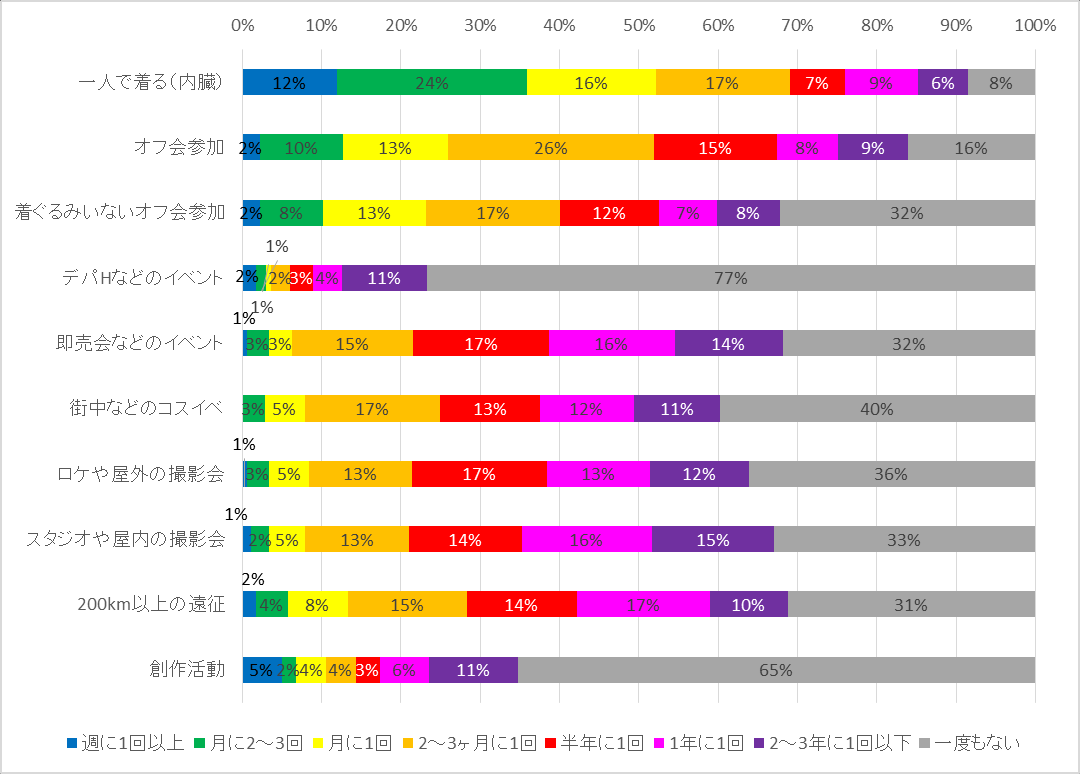 Figure 46: Frequency of Kigurumi activities and local disparities by place of residence
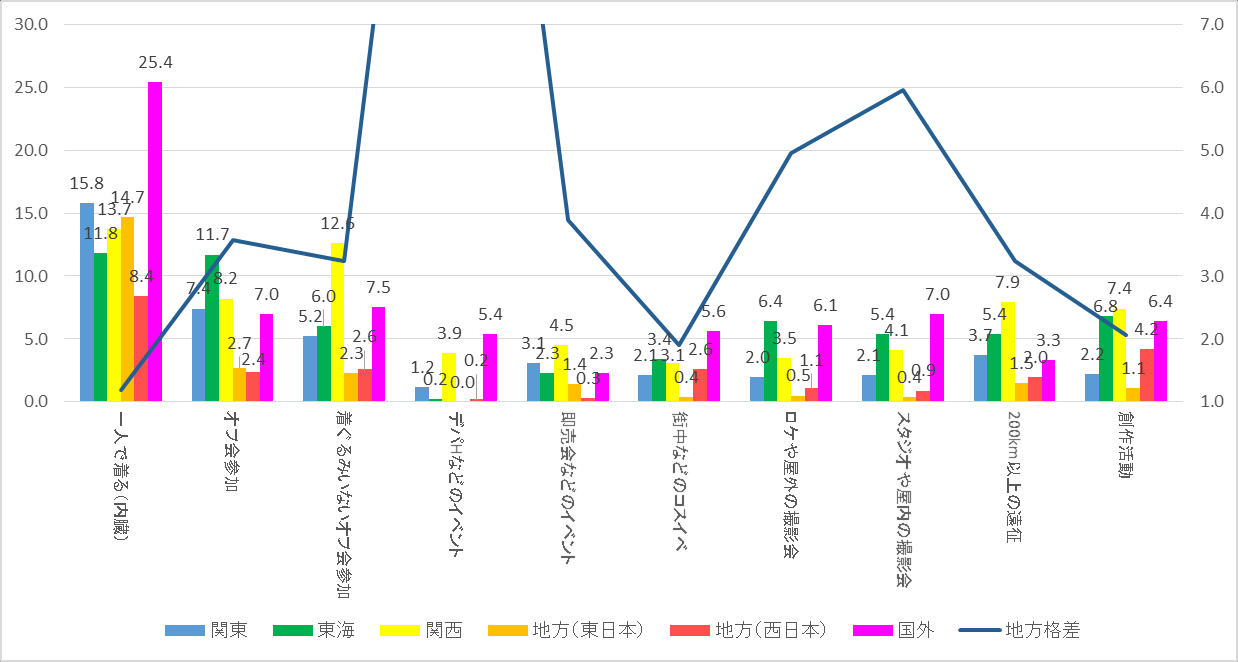 Figure 47: Relationship between pride in kigurumi preferences and the frequency of project activities
18. Kigurumi activities expenditure
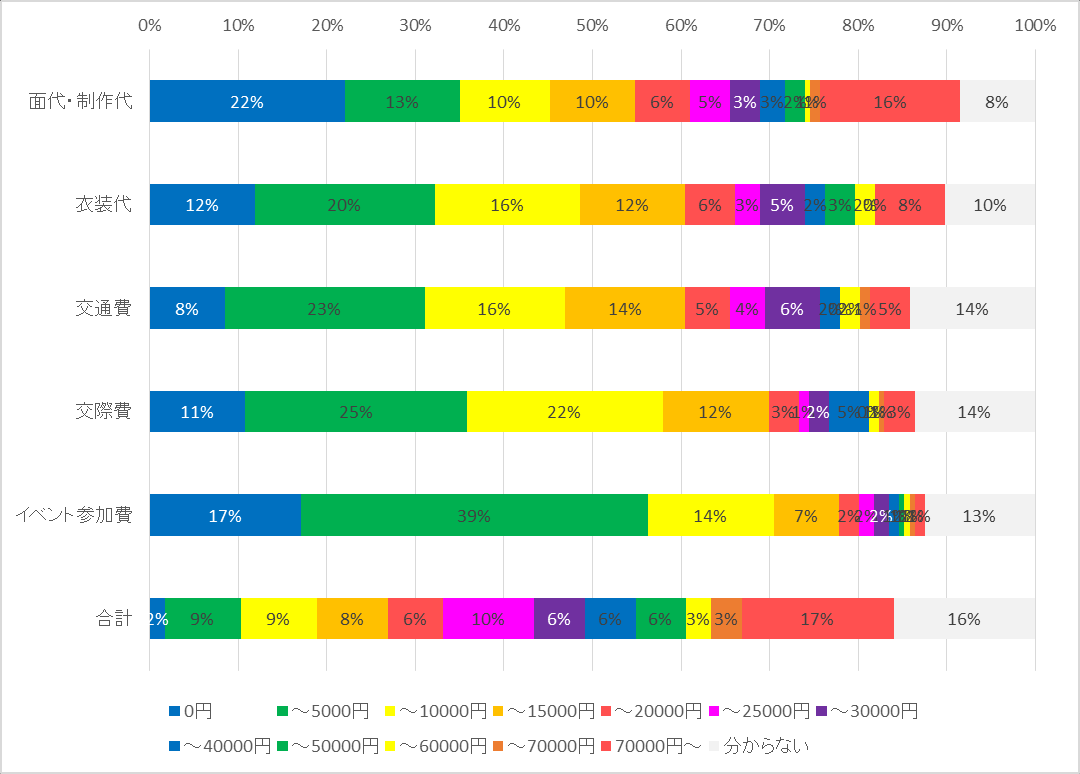
Figure 48 summarizes the average monthly expenditures of the activists on Kigurumi activities. However, with regard to this question, I suspect that a large number of respondents have misread the term “month averages of the past 2 years” as “totals of the last 2 years” (because it is hard to imagine a monthly participation fee of 50,000 yen for an event or an event of 1.2 million yen for an event). First of all, I think that I should not deliberately add the phrase “two years back”; that the totals should also be divided into categories; and that the amount ranges should be more detailed in order to obtain a more accurate range of class values. Take this opportunity to apologize. Therefore, this question is not analysed in detail. The total expenditure of active and effective respondents excluding “not known” was on average 36,000 yen/month, but for the reasons mentioned above, only for reference purposes. For insurance purposes, I have also investigated its relevance to annual income, but no significant differences have been found.
Figure 48: Average monthly expenditure for Kigurumi activities
19. Discovery in real life
Figure 49 Summarizes the situation of activists who are found or informed in real life. The person known to the father is 25%, the person known to the mother is 35%, there's a difference. Fifty per cent of the people told “friends and friends”, but, on the other hand, only 25 per cent of those who told “friends” other than friends and relatives, there was a difference between being told and not being told, even among friends. Fewer people, 20%. When notified or discovered, the most important is a neutral response; but there is more positive than negative reaction. Among the inactive/sluggered, the father knew (and probably knew) 12 per cent, the mother 19 per cent, family and friends 24 per cent, friends 8 per cent, workplace 0 per cent and spouse/partner 5 per cent.
Table 11 Summarizes the real-life discovery rate of the active persons by geographical composition. 48-68 per cent of those who live in their homes are known to their parents, while only 25-33 per cent live alone. In addition, people living in their homes not only have higher rates of awareness among their parents and brothers, but also among relatives and friends. The partner who lives with the spouse is aware of 83 per cent (44 per cent positive, 22 per cent neutral, 17 per cent negative and more positive).
Figure 50 presents a summary of what has been discovered in the real life of the activists by “how proud of Kigurumi”. Whatever the object, the more proud the person, the higher the level of discovery or communication in real life. In particular, the answer to the question of "proud" is more than 50 per cent.
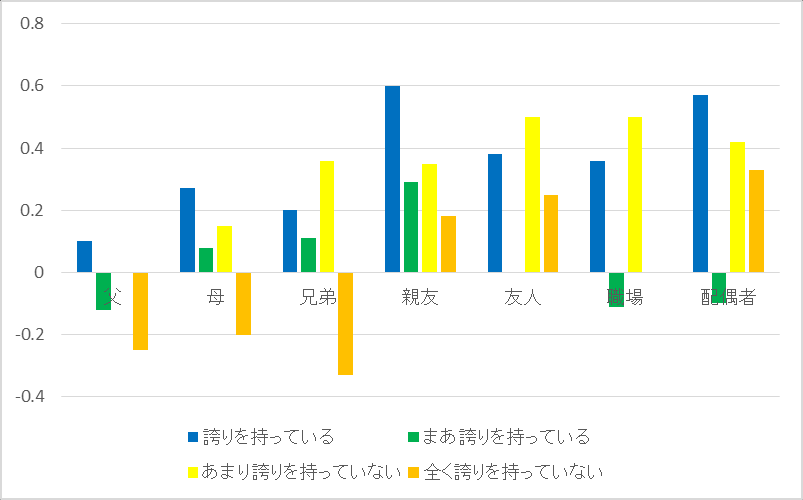
Figure 51 illustrates whether I am proud of kigurumi and how it relates to the reaction around the time of discovery in real life. Peripheral reactions are directed at persons known to be the object, with “positive reactions” being recorded as 1 point, “neutral reactions” as 0 points, “negative reactions” as -1 points, and averages calculated. The higher the value, the greater the acceptance around. It is important to note that if I do not feel proud, I may first be undetected or uninvolved; but the more I am proud of Kigurumi as a whole, the more positive the reaction is.
| Object | He lives at home. | Living alone. | Cohabitation with spouse |
|---|---|---|---|
| Father. | 48 | 25 | 35 |
| Mother. | 68 | 33 | 40 |
| Brothers and sisters. | 50 | 29 | 35 |
| Friends. | 58 | 49 | 52 |
| Friends. | 35 | 26 | 37 |
| Career | 22 | 20 | 25 |
| Partner | 22 | 20 | 83 |
Table 11: Discovery rate in real life by sex (%)
Figure 49: Discoveries in real life of activists
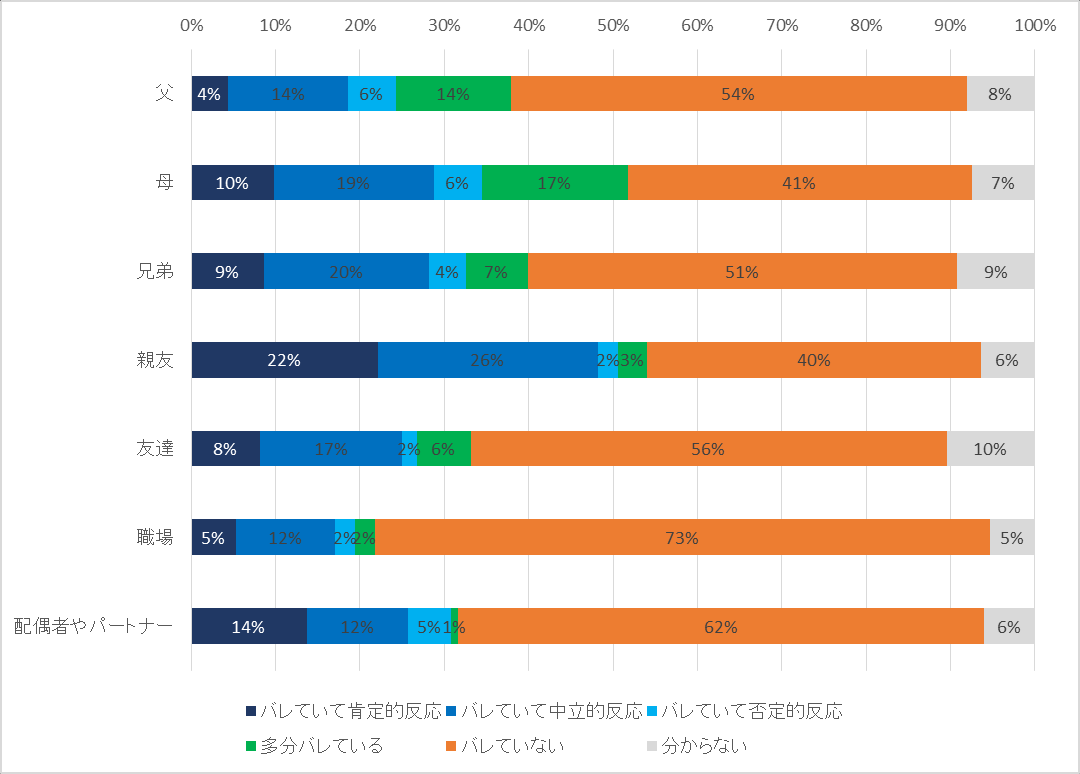 Figure 50: Discovery rate in real life by pride in Kigurumi's hobby (except “presumably discovered”)
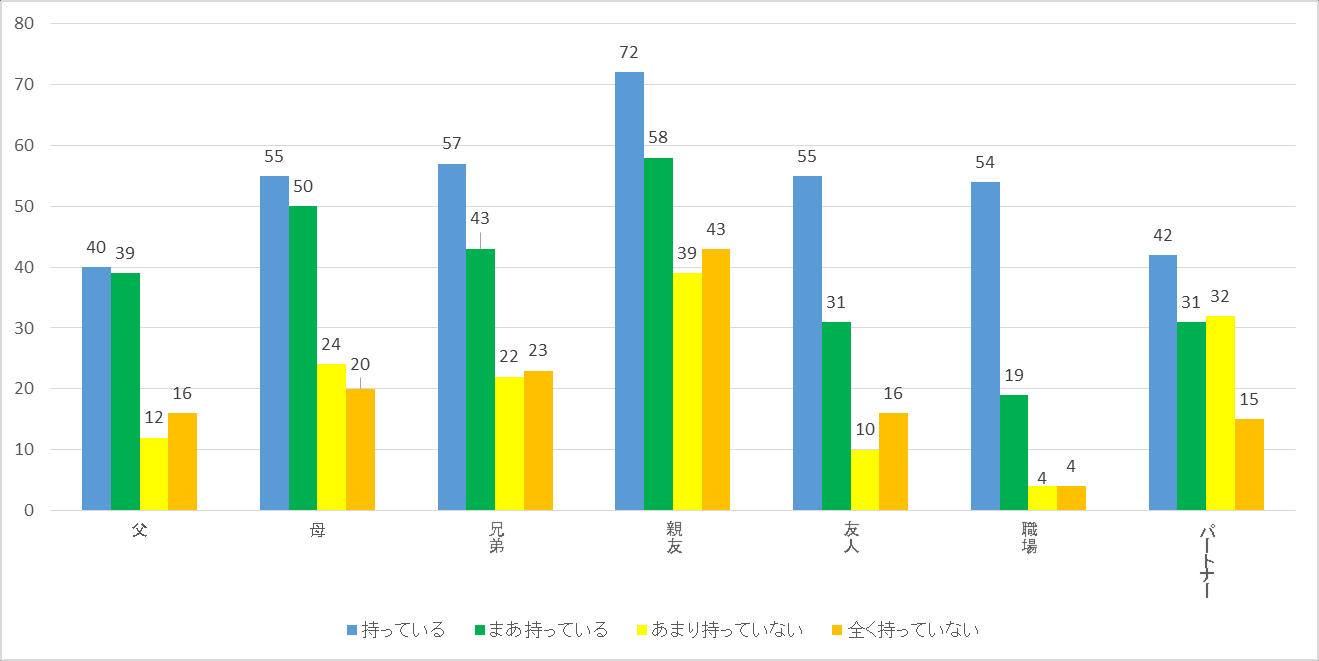 Figure 51: I'm proud of kigurumi's passion in relation to the reaction to the discovery of real life.
20. Charmous areas
Figure 52 shows which of the following are the most attractive areas of the “kigurumi hobby” for 214 effective respondents: pure photo fairs, peer chats, adult/love behaviour, and the general population greening. The most frequent is “acts of adults/loves, etc.”, 34%. This was followed by 25 per cent for “challenging with peers”, 20 per cent for “pure photography” and 15 per cent for “greating with the general population”.
Figure 53 shows the responses by activity. Among those who are “not yet active” “mostly dressed alone”, “acts such as adult/love” dominates by more than 50 per cent. On the other hand, among people who are “acting or off wearing kigurumi”, “talking with their peers” was highest at 33 per cent, followed by “acts of adults/loves, etc.” and “greating with the general population”, 26 per cent each. Among the “photographic/support specialist”, “pure photo fairs” and “adults/loves, etc.” were the most numerous, at 29 per cent each; no one chose “greeting with ordinary people”.
Figure 54 shows the glamour areas by area of activity. The choice of “adults/loves, etc.” is higher in East Japan, where it is 40 per cent in Kanto and 50 per cent in the locality (East Japan). The choice of “with the general population” is higher in West Japan, 27 per cent in Kansai and 28 per cent in the locality (West Japan); no one in the locality (East Japan). The choice of the first person to communicate, such as “challenging with peers”, is higher in the Tokai and Local (West Japan) with 48% and 39%, respectively. The “pure photo fair” area varies less.
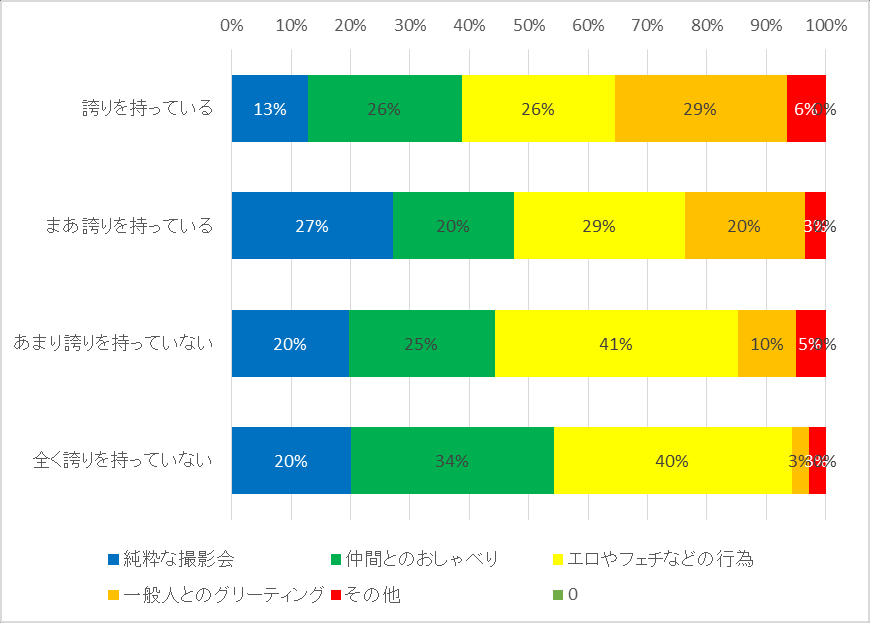
Figure 55 shows how proud of Kigurumi's hobby is related to the answer in the field of glamour. The more proud they are of kigurumi, the more they prefer to “greeting with ordinary people” and the less proud they prefer “acts such as adult/love”.
Figure 52: The charisma of kigurumi
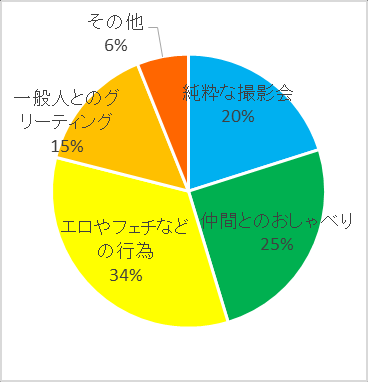 Figure 53: Kigurumi Charms by Activity Form
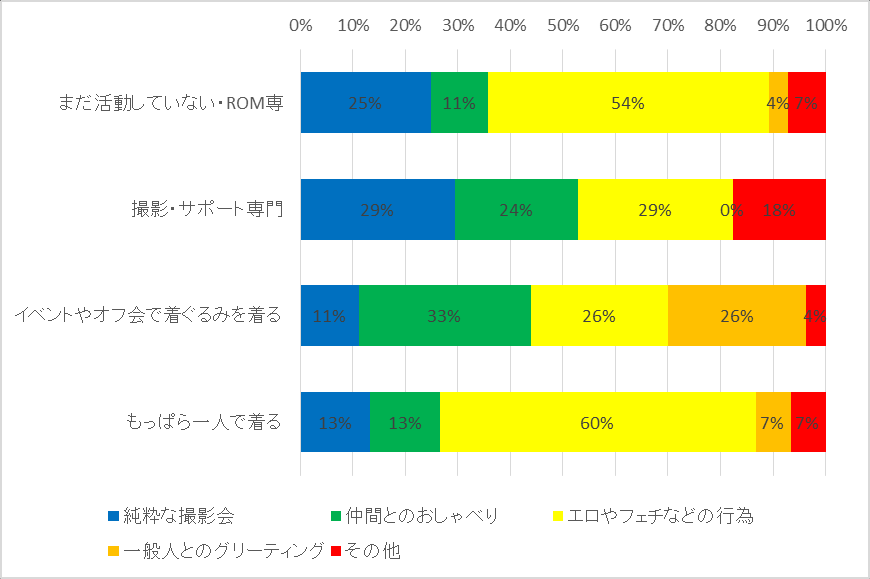 Figure 54: Kigurumi Charms by Region
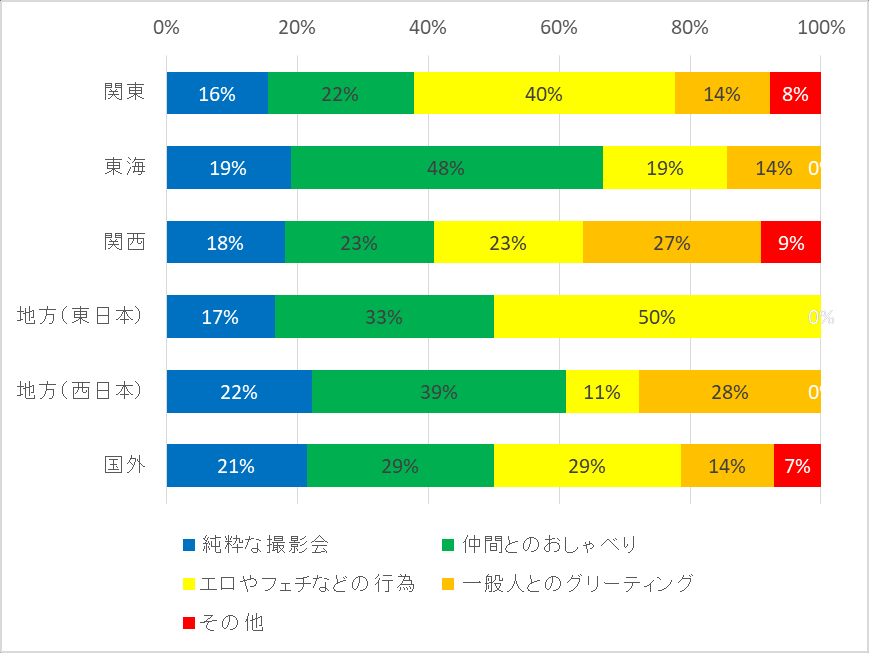 Figure 55: Kigurumi Charms by pride in kigurumi preferences
21. Sexual self-identification and sexual orientation
Figure 56 shows the sexual self-identification of 203 male effective respondents. 89% for men. The answer to “female” was 1%, “neither male nor female” 6%, and “never known” 4%. The sexual self-identification of 9 women is 100% female.
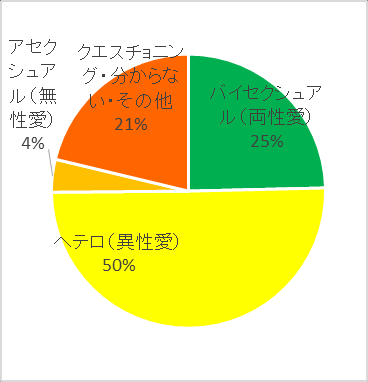
Figure 57 shows the sexual orientation of 207 valid respondents. No gay person, 25% bisexual, 50% heterosexual. The remaining 25% is sexless, questing, etc. Bisexuality is 19%, heterosexuals 56%, nonsexuals 2%, Questing 22%, etc. When it is observed that the sex of the household is male and that the sex is not “male”, it is 52 per cent bisexual, 9 per cent heterosexual, 22 per cent nonsexist and 17 per cent Questing.
Figure 56: Sexual self-identification by male respondents
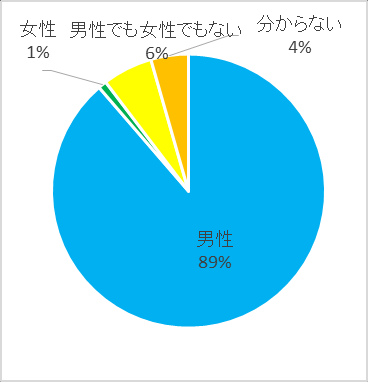 Figure 57: Sexual orientation
22. Partners
Figure 58 shows whether 204 valid respondents had same-sex partners and their experiences. Five percent says "there is now," seven percent says "there has been."
Figure 59 shows the existence and experience of same-sex couples by sexual orientation. 13% of bisexuals now have same-sex couples, 23% have had sex in the past. Ninety-seven per cent of heterosexuals and 92 per cent of others have no homosexual partner.
Similarly, figure 60 shows whether 205 valid respondents have a heterosexual partner and experience. 18% answered "there is now," 33% used to.
Figure 61 shows the existence and experience of heterosexual couples by sexual orientation. Sixteen per cent of bisexuals now have heterosexual partners and 49 per cent have had heterosexual partners in the past. Twenty-one percent of heterosexuals now have heterosexual partners, 32 percent have had them in the past. It should be noted that more heterosexuals than bisexuals have never had a heterosexual partner.
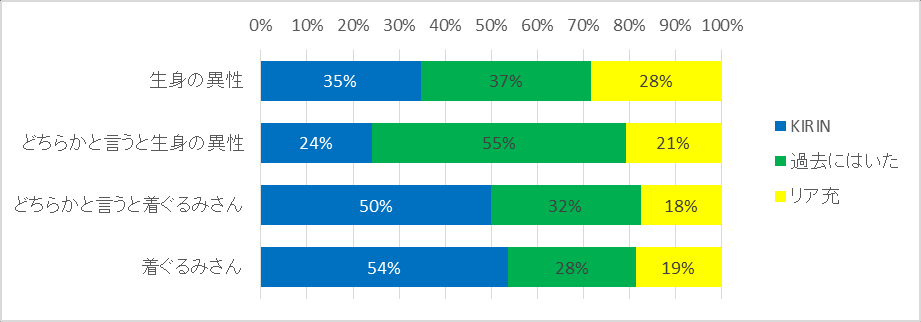
Based on these results, figure 62 shows the relationship experience of 217 effective respondents. Whatever the opposite sex, Kirin, who never had a girlfriend/boyfriend, = Kanojo Inai reki Iko-ru Nenrei, “Time equals age without a girlfriend/boyfriend”, is 43 per cent; 21 per cent of the persons with a girlfriend/boyfriend are now realistic; 36 per cent are not, but have been in the past.
Figure 63 shows the relationship experience by region. The East China Sea region has a much larger reality, 42 per cent of which says "with a partner." KIRIN is less present in the Tokai and Kansai, and more in Kansung, local (West Japan), local (East Japan) and overseas.
Figure 64 shows the relationship between a sense of pride in kigurumi and a relationship experience. The more proud people who love kigurumi, the less they have had love experience in the past; the less proud they have had partners in the past. However, the current percentage of full-time people does not depend on a sense of pride in kigurumi.
The answer to the question of “breeding and kigurumi, which is more excited” is in relation to the previous relationship experience. More than 50 per cent of the respondents to the "relationship of kigurumi" “kigurumi” were Kiran. But on the other hand, about 20 percent of the people are full of reality. Thirty-five per cent of the respondents to the answer to "living opposite sex" were KIRIN; 24 per cent of respondents to the answer to "relative opposite sex" were KIRIN and there was a reversal. However, the proportion of people who actually complete the reality is 28 per cent among those who answer the question “preferably”, 21 per cent among those who answer “preferably”, and more often among those who have the opposite sex (but couples here include same sex).
Figure 58: Same-sex couples with or without experience
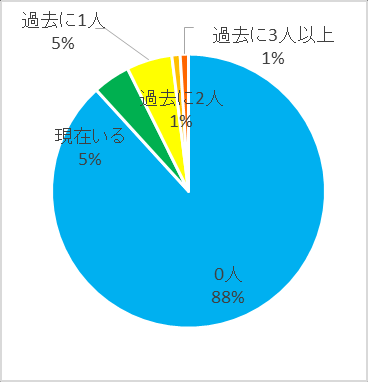 Figure 59: Availability and experience of same-sex couples by sexual orientation
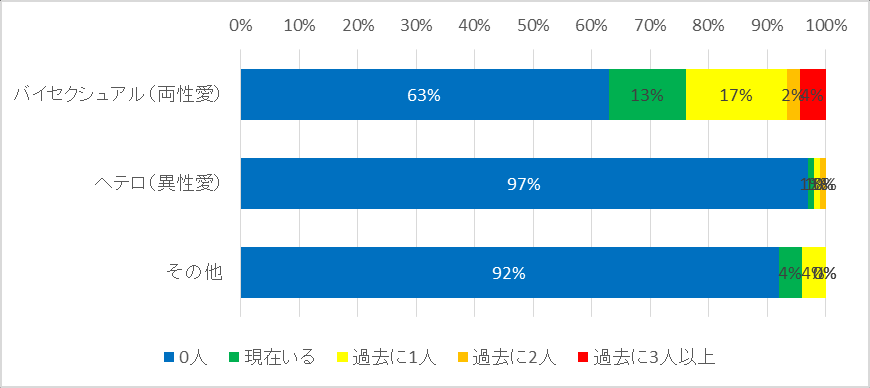 Figure 60: Have heterosexual couples
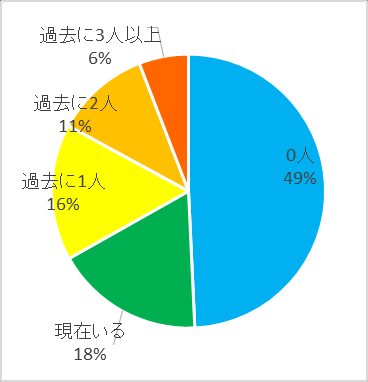 Figure 61: Availability of heterosexual couples by sexual orientation
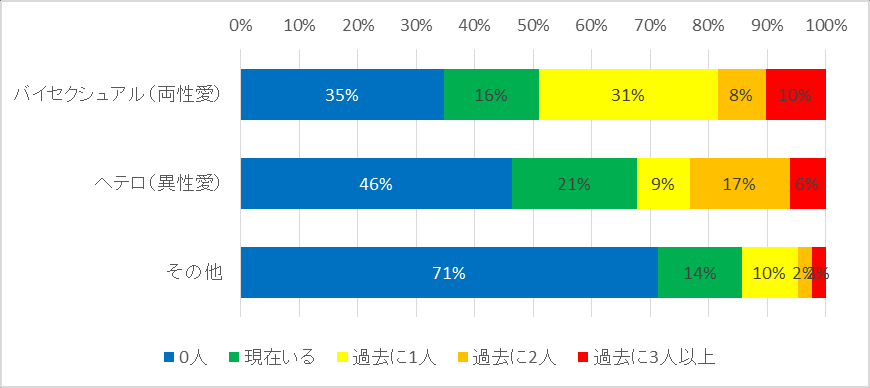 Figure 62: Relationship experience
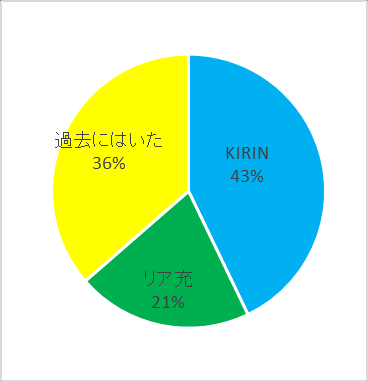 Figure 63: Relationship experience by region
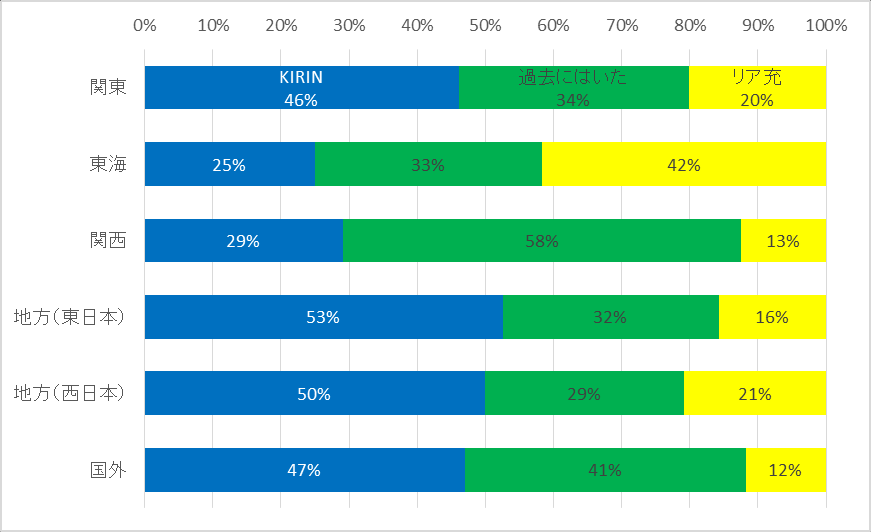 Figure 64: Relationship experience by pride in kigurumi
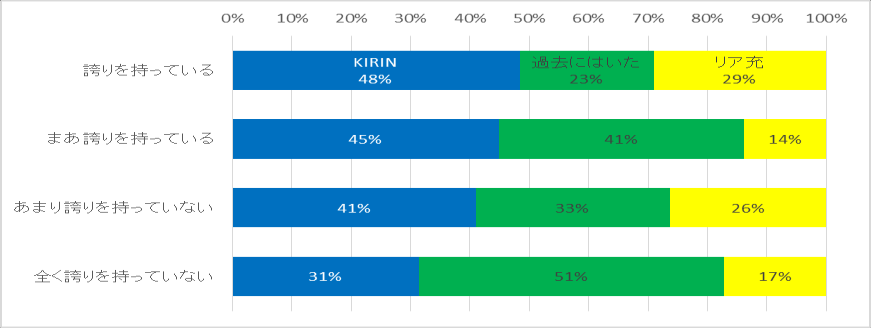 Figure 65: Relationships between transvestite/kigurumi excites and relationship
23. Marriage
Figure 66 shows the marriage views of 211 valid respondents. The answer to “married or ever married” was 12 per cent. The number of people who want to get married, even if they quit the hobby, is 7%, and the number of people who want to get married is 27% if they can accept the hobby. The number of persons who “wanted to marry if they could, but did not give serious consideration” was 28 per cent. The number of people who “do not want to marry” is 14 per cent, and 12 per cent of those who “not have no desire to marry but have given up”.
Figure 67 shows the marriage outlook by age. Among those under the age of 20, “if they can accept this hobby, they want to get married” is the highest, at 44 per cent, and no one has given up marriage. In addition, there are “deeply willing to get married even if you quit the hobby” up to the age of 29. People over the age of 30 are almost non-existent, but have given up” at the age of 25-29, less than at the age of 20-24, but have increased with age. Of those over 40, 33 per cent have given up their marriage. On the other hand, there has been a sharp increase in the actual number of married persons over 30 years of age and 33% of those over 40.
Figure 68 shows the concept of marriage by sexual orientation. Married persons are 18 per cent bisexual and 14 per cent heterosexual. Positive responses to marriage, such as “if you want to get married” “if you want to get married”, are 48 per cent for bisexuals and 40 per cent for heterosexuals. Bisexuals are slightly more certain about marriage than heterosexuals. On the other hand, 35 per cent of non-sexuality or Questioning, among others, said, "I don't want to get married."
Figure 69 illustrates the relationship between the answer to “breeding heterosexuality and which Kigurumi is more excited” and the idea of marriage. About 20 per cent of the respondents to the “breather and more excited” “breather” are married, while less than 10 per cent of respondents to the “breather and more excited” “kigurumi”. Moreover, the more excited people are at Kigurumi, the more they “do not want to marry” “not without their will but have given up”.
Figure 66: Marriage
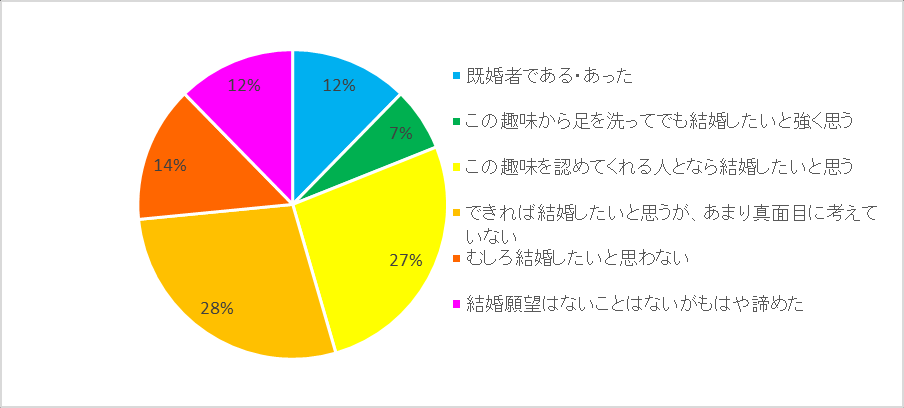 Figure 67: Marriages by age Watch
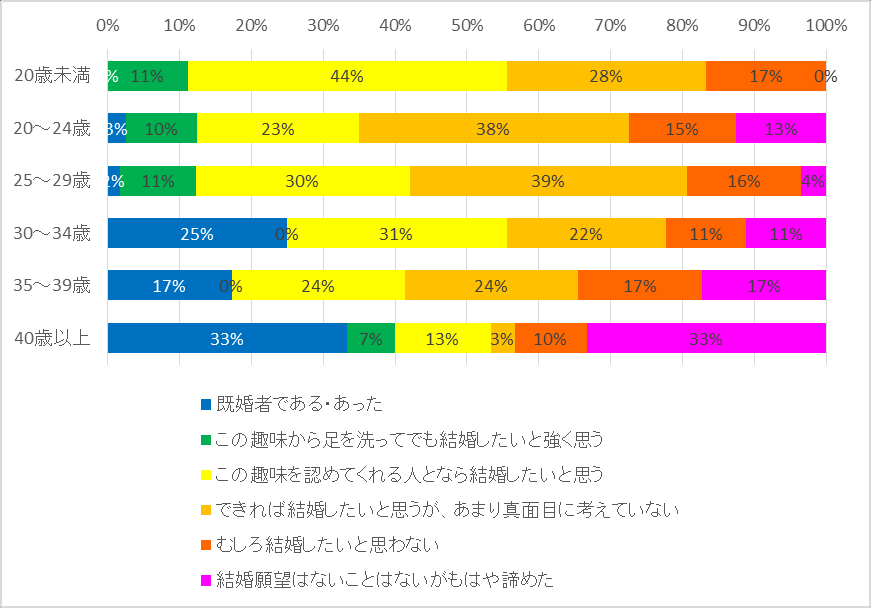 Figure 68: Marriages by sexual orientation Watch
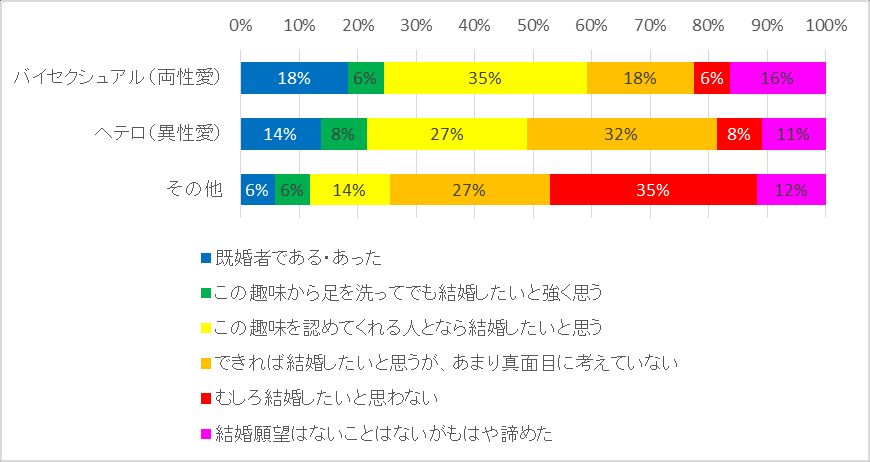 Figure 69: Transsexual/kigurumi excites and marriage views
24. Experience in sexual bargaining
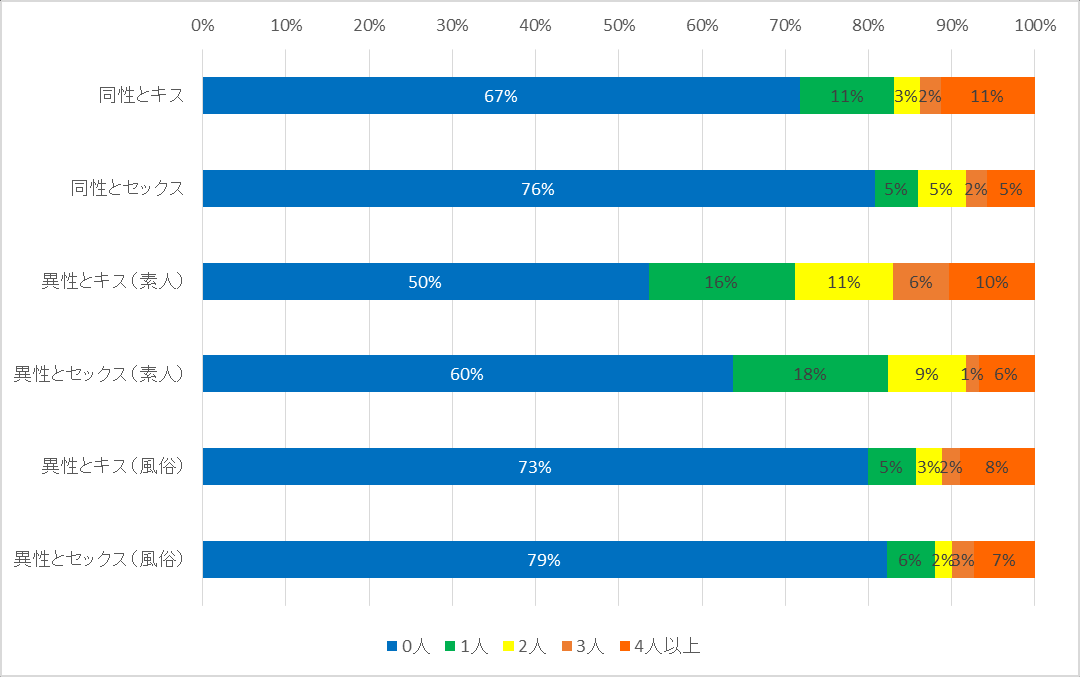
Figure 70 Summary of the sex trade experience of 195 effective respondents. Thirty-three per cent of people have had same-sex sex, 24 per cent have had same-sex sex, 50 per cent have had non-traditional heterosexual sex and 40 per cent have had heterosexual sex. The use of custom is about 20-30 per cent. In addition, on the basis of these results, the rate of no sexual experience among respondents was 52 per cent, 44 per cent for the general target group and 4 per cent for the only traditional experience.
Figure 71 illustrates the relationship between the answer to “breeding heterosexuality and which of Kigurumi is more excited” and the rate of experience in sexual bargaining. Less than 40 per cent of people who respond to heterosexuals who are more excited have no experience; about 60 per cent of those who answer Kigurumi have no experience (however, even if they do not have sex with heterosexuals, it is considered “experienced” if they have sex with homosexuals).
Figure 72 shows sexual bargaining experience by kigurumi awakening period. The earlier you woke up with Kigurumi, the higher the inexperience rate. The rate of inexperienced persons awakening in secondary school is 72 per cent, while only 29 per cent of those who wake up are social.
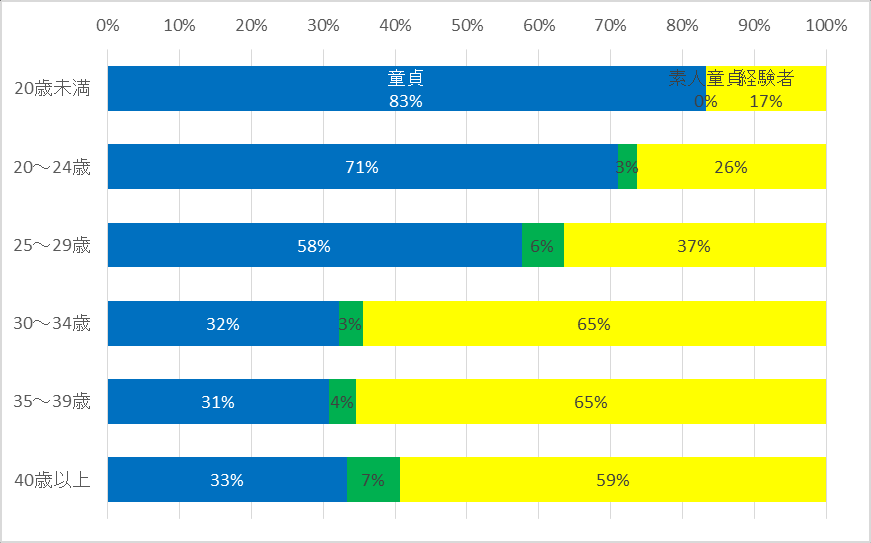
Figure 73 By the age of 30, the rate of inexperience has decreased with age; it has since stabilized. The inexperience rate (100 - male sexual experience rate per cent) in JEX japan sex Survey (2013) is 54%, 25 - 29 38%, 30 - 34 27%, 35 - 39 17%, 40 - 44 10%; this survey is higher than the average inexperience rate for average Japanese males at all ages.
In addition, when looking at sexual bargaining experience with a sense of pride in Kigurumi ' s hobby, the inexperience rate of people who are proud of Kigurumi is 55 per cent, and of people who are not proud is 44 per cent.
Figure 70: Respondent ' s sexual bargaining experience
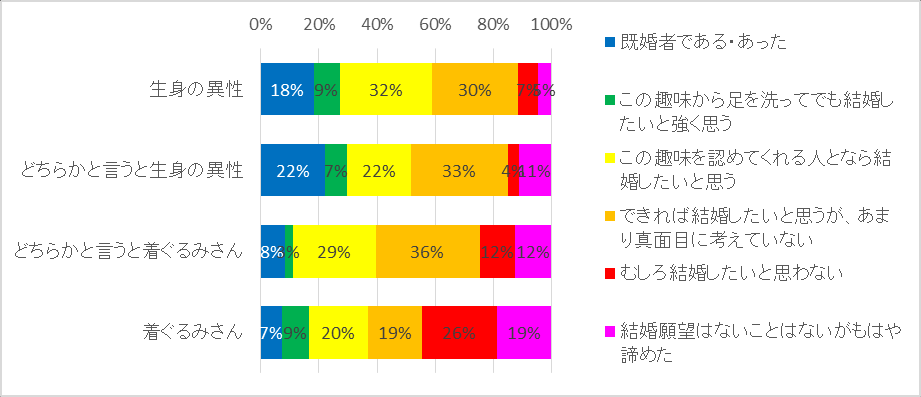 Figure 71: Sex intervention experience by biological heterogeneity/kigurumi
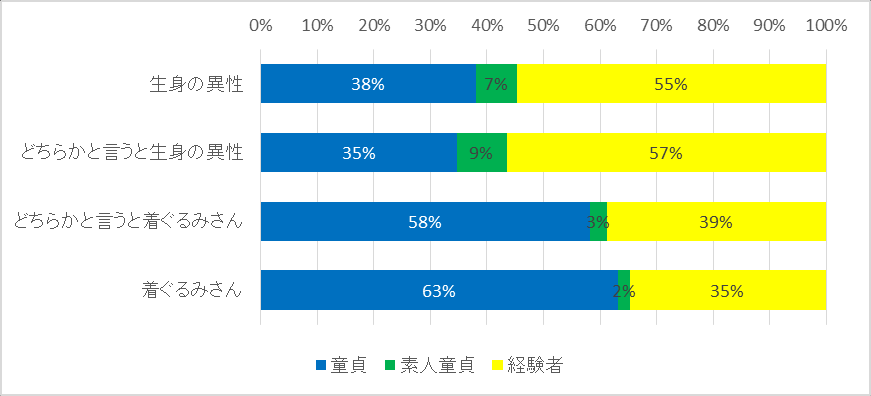 Figure 72: Sexual bargaining experience by kigurumi awakening period
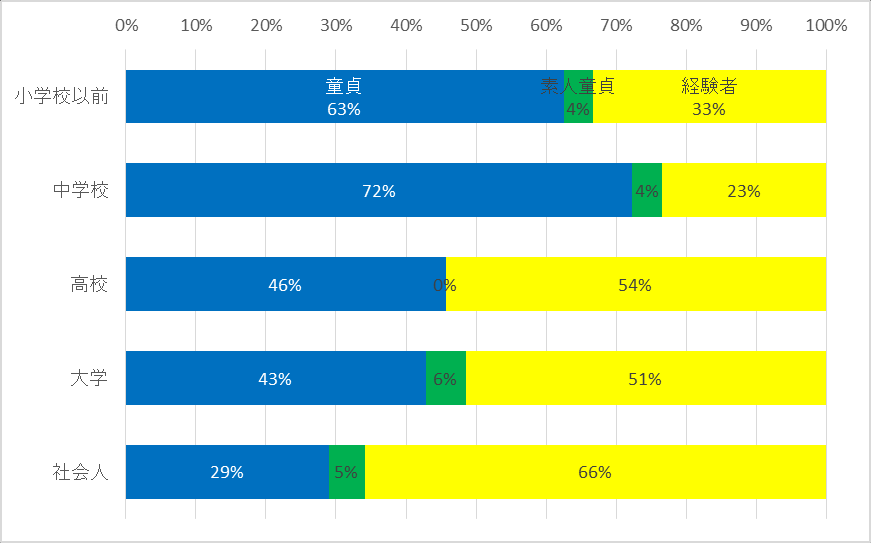 Figure 73: Experience with sex bargaining by age
25. Interest
Figure 74 shows the interest of 217 valid respondents (multiple selections). The most frequent is “watching animated”, followed by “on-line surfing” “traveling” “reading/reading comics” “drink/food”.
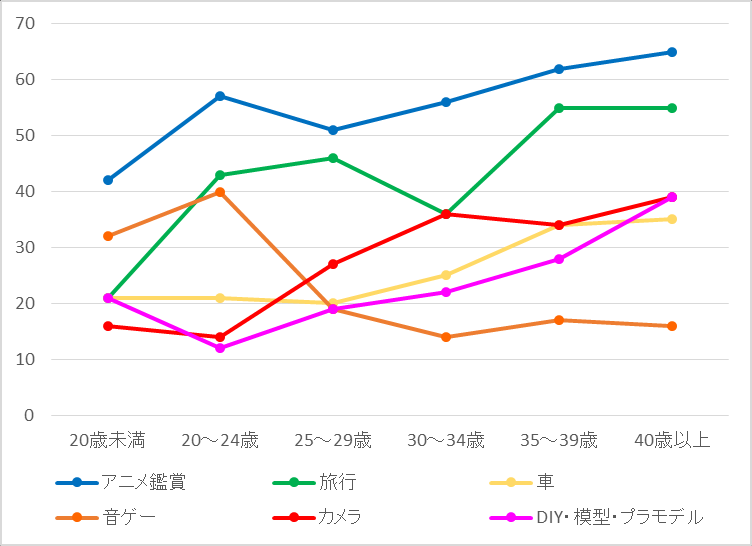
Figure 75 shows the interest mainly in age differences. There are differences in the "DEY/model/plastic model" for "watch animated" "travel" "car" "show" "show" "chip" "diY/model/plastic model". Among them, “showing” decreased with age, and the proportion of people who answered it was of interest. Other interest increases with age and the proportion of respondents who respond to interest.
Figure 74: Respondent ' s interest
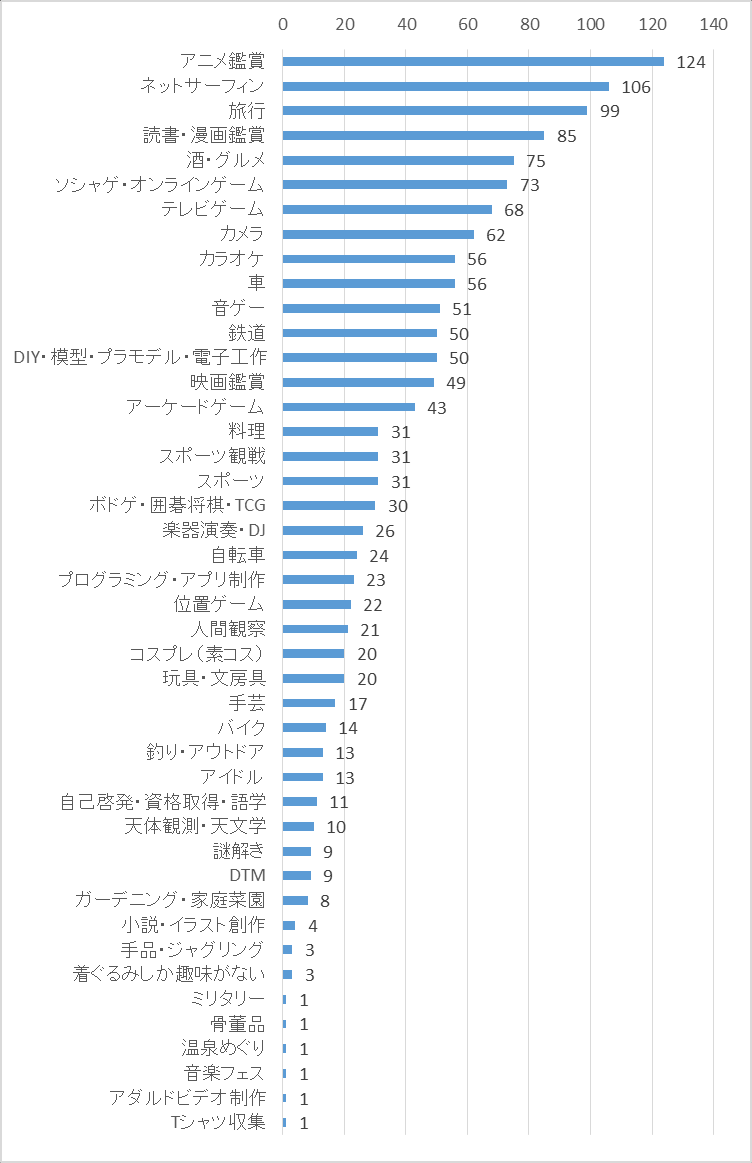 Figure 75: Percentage of respondents of interest by age
26. Pattern of rest days
Figure 76 shows the options for 210 effective respondents that best fit their own day off. The largest was “input interest outside Kigurumi”, which accounted for 29 per cent. The second is “to spend alone at home” with 26 per cent and “to participate in activities or off meetings” with 17 per cent.
Figure 77 “Activities” only, showing the pattern of rest days by region. In the Eastern Circle, “participating in or off” is more prominent, accounting for 43 per cent; in Kanto and Kansai, it is also 20 per cent; but in smaller places, it is 0 per cent local (East Japan) and 6 per cent local (West Japan). The “interest outside Kigurumi” is higher in Kansai and the locality (East Japan), at 45 per cent and 50 per cent, respectively. In the overseas world, more “lives with family”, at 31 per cent.
Figure 78 shows how people spend their rest days by age. Among those under the age of 25, there are more “living alone at home”; in the age of 25-34, there is an increase in “participating in or off meetings” and in “interest outside Kigurumi”; and over 35 years of age, there is a decrease in “participating in activities or off” and an increase in “living at home alone”.
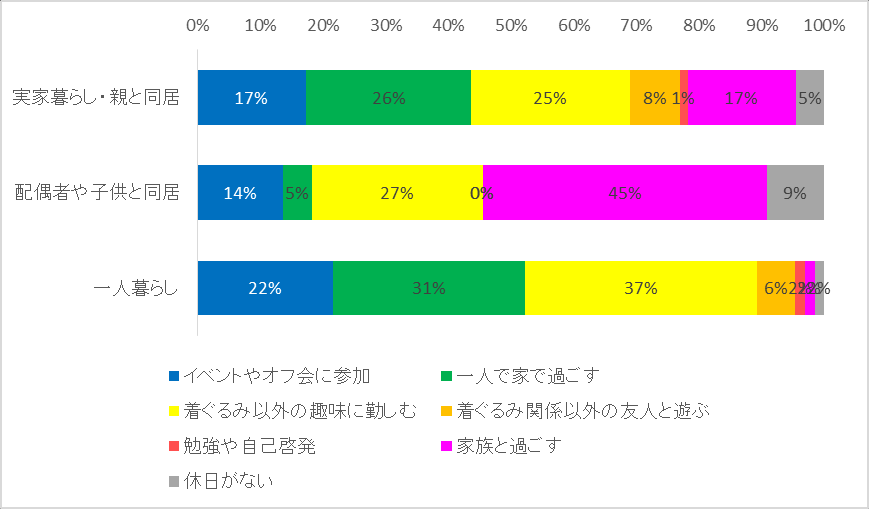
Figure 79 shows how the rest days are spent by the composition of the community. The proportion replying to “participation or off-membership” was the highest, 22 per cent. The number of people living in their home country was 17 per cent and the number living with their spouses was 14 per cent. The “interest outside kigurumi” is highest among those living alone, at 37 per cent. Among those living with their spouses, 45 per cent responded that they “live with their families”.
In addition, the more proud people opt for “participating in or off” the higher the degree of pride in kigurumi's hobby.
Figure 76: How the rest days are spent
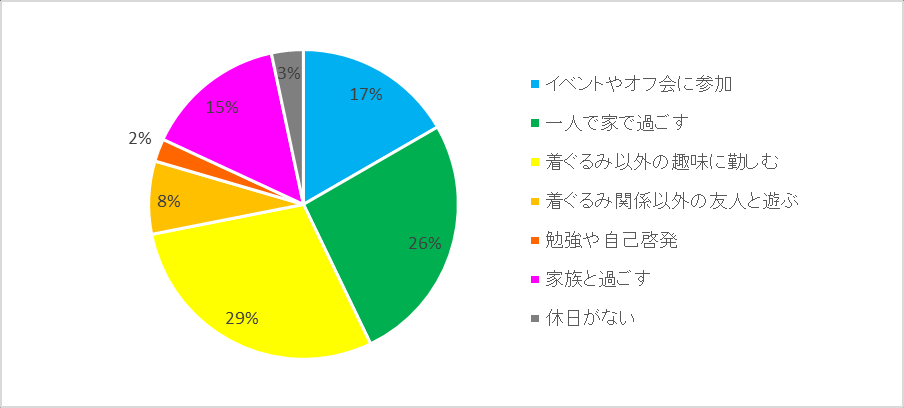 Figure 77: Days spent by region
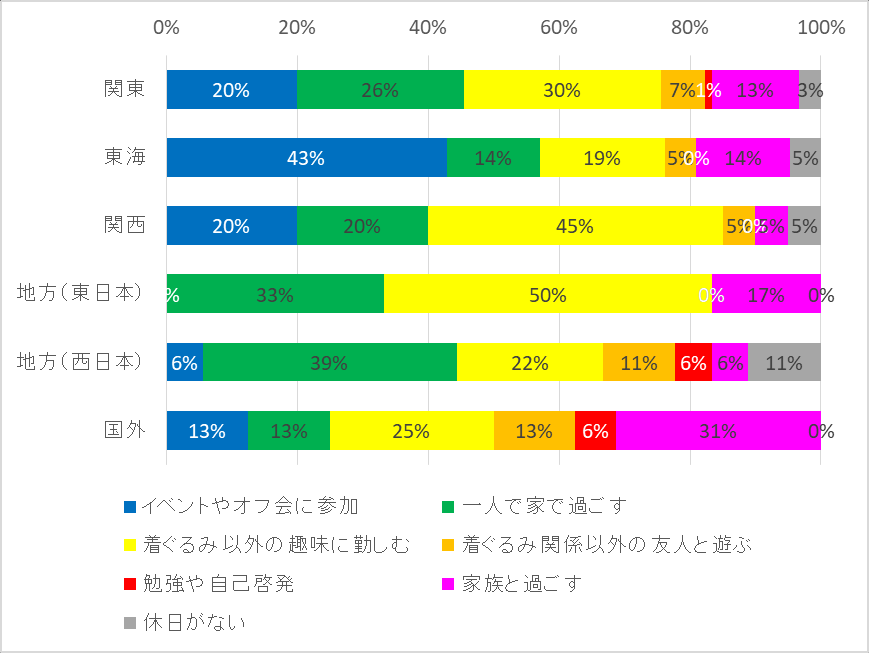 Figure 78: The pattern of rest days by age
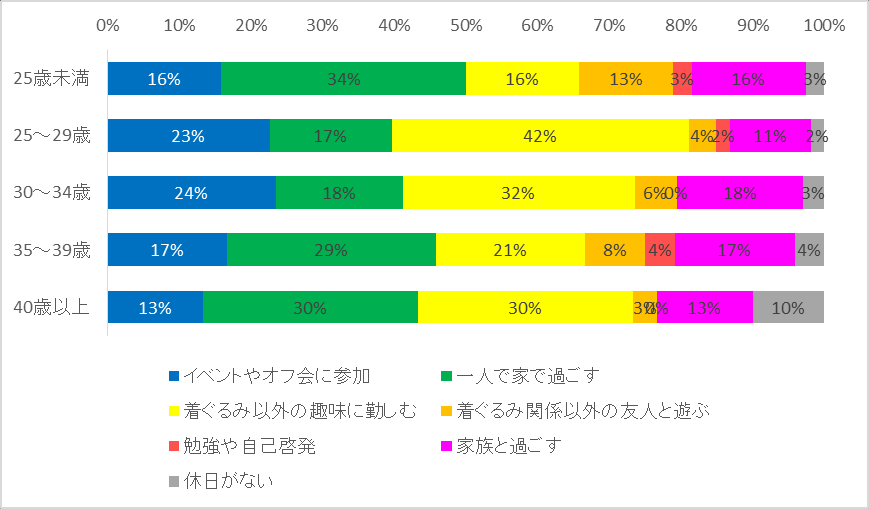 Figure 79: how the rest of the world is spent, by composition
27. Views on official show, female dress, and non-human Kigurumi
Figure 80 shows the views of 218 effective respondents, including those who answered “not know”, on the “official show” “women's clothes” “other than kigurumi”. In all projects, the answer is definitely over 60 per cent. The negative responses, which included “no interest”, were: official show 21 per cent, female dress 30 per cent, and non-human kigurumi 23 per cent.
Among the amateur girls Kigurumi, men often play girls. Figure 81 shows the relationship between “whether this gender is perceived to be attractive across borders” and the perception of the official show, which is usually held by women. Those who know that gender is attractive across borders are more inclined to respond positively to official shows. However, the rates of "like " and " prefer " are 35 per cent and 34 per cent, respectively. On the other hand, while the percentage of positive answers to official shows is lower than for those who do not think that gender cross-border is attractive, the “like” rate is 53 per cent and “like” 6 per cent. In addition, none of the people who do not think that gender cross-border is attractive answered the official "not very much" or "not very much".
Similarly, figure 82 shows the relationship between the glamour of gender transborderity and the perception of female dress. The answer to the answer to the word “better” was about 70 per cent; the answer to the word “better” was certainly less than 50 per cent, and there were more negative answers to the word “uninterested” than yes.
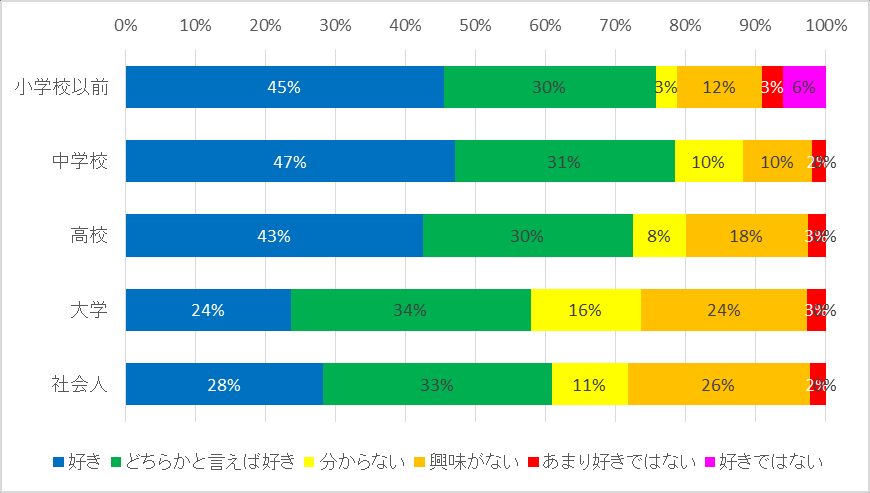
Figure 83 shows the view of the official show kigurumi by kigurumi awakening period. The sooner you wake up, the more sure the official show will answer. The perception of kigurumi, both female and non-human, does not reveal a clear reliance on the awakening period. Nor does it depend on a sense of pride in kigurumi.
Figure 80: Views on official show, female dress, kigurumi outside human form
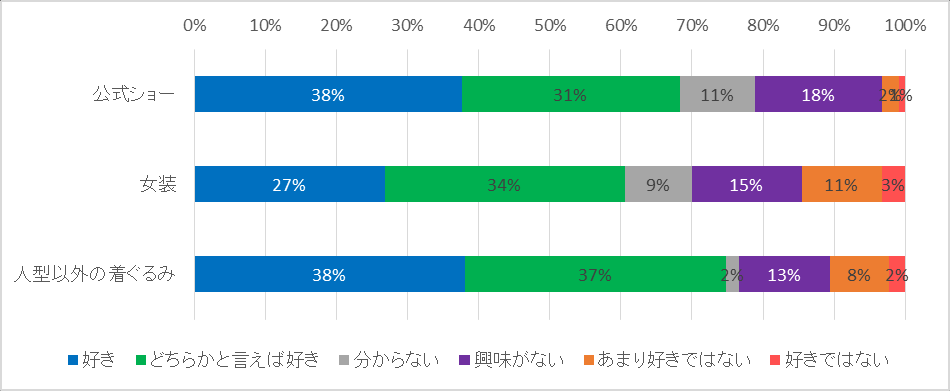 Figure 81: An official view of Kigurumi by gender and cross-boundary charisma among amateur American girls
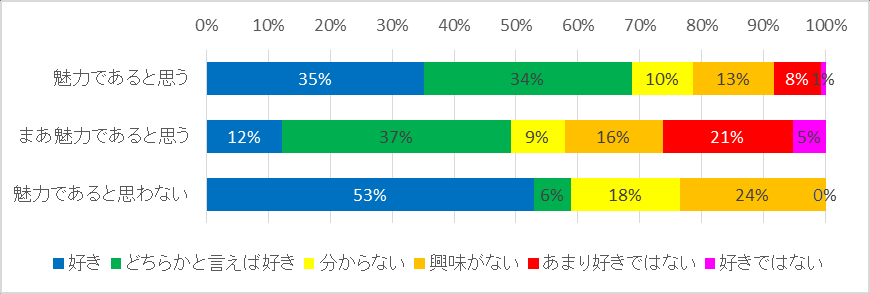 Figure 82: Perceptions of women ' s dress by gender of cross-border charisma among amateur girls, Kigurumi
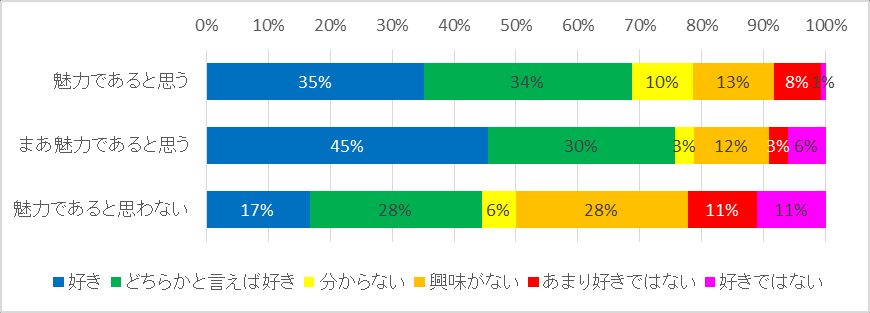 Figure 83: Official show kigurumi views by kigurumi awakening period
The idea of wearing one's mother to others.
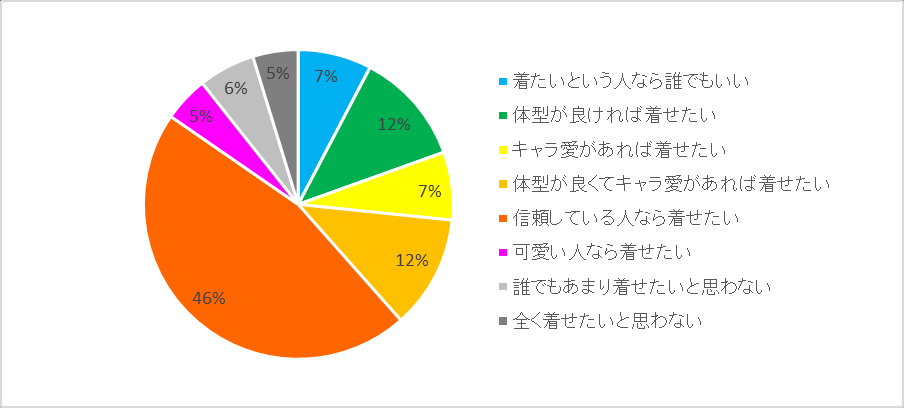
Figure 84 shows the views of 161 effective respondents with their own "mothers" who wore their "mothers" to others. 46% answered, "If a trusted person wants him to wear it." As a condition of access, 12% of those who choose “body” and 7% of those who choose “role love” are choosing 12%. And seven percent said, "Whoever can wear it if you want to wear it," and, on the other hand, 11 percent had negative feelings about getting someone to wear it.
According to the region, Kansai-Change wants to wear "whoever you want to wear" and "whoever you want to wear" and "who's got a role to love" and "who's got a role to wear" and "who's got a role to wear" totalling 20%, "who wants to wear if you want to trust" to be 65% and more trust. In the East China Sea, on the other hand, “whoever you want to wear”, “whoever you want to wear”, “whoever you want to wear, you want to wear”, “who has a role to love, you want to wear”, 45 per cent, “who wants to wear if you trust”, 45 per cent, and a tendency to focus more on conditions other than trust. Overseas, there are more than 20 percent of people who want to wear it.
Figure 84: Perpetrators of kigurumi's perception of wearing their mother to others
29. Self-evaluation of the form of the mother, the body and the performance of the act
Figure 85 shows the results of 169 valid respondents who responded that they had a "mother" and self-evaluated their "mother" and answered the highest score. Twenty-one per cent of the responses were “unable to score”, and no self-assessment was conducted. Also, 18% gives '100 points'. Of the remaining 61%, 90 points are higher, but 11% give less than 80 points. The average of 91 points after excluding the "unable to score " .
The average score by length of activity averaged 89-92 in 10 years; 94 in 10-15 years and 95 in over 15 years, which increased. In terms of ownership, the average of the body up to 6 is 90-92; 7 and above rises to 94. Moreover, the proportion of “unable to score” does not depend on activity seniority or ownership.
On the other hand, figure 86 shows the results of a self-assessment by 125 effective respondents of their “mothers” and answers to the lowest score. Thirty-one per cent of the respondents replied that “can't score” and that more people refused to score than previously mentioned. Only 6% of those giving more than 90, and only 14% of those giving more than 80. Answer below 60 17%. Less than 70 minutes of the average pointer's time.
On average, by year of activity, it was roughly 66-70 in 10 years; in 10-15 years it rose to 78, but 63 in more than 15 years. On the face count, 2 bodies are 74, 3 bodies 67, 4 bodies 74, 5-6 bodies 70 and 7 bodies above 64.
Figure 87 shows the relationship between a sense of pride in kigurumi's hobby and the self-assessment of the results by his mother. None of the people who answered the question “with pride” were 80 points below, but less for 100. The less proud, the more 80s and 100s, the more polarized.
Figure 88 shows that 145 valid respondents who responded that they were inside performer rated their own body. The largest is “71-80 minutes”. Thirty-two per cent of the respondents were given more than 71 points; on the other hand, 11 per cent were given less than 20 points. The average is 56 minutes.
In addition, the body-size self-assessment by height of the person who answered inside performer was: 160 cm under 54, 160-165 cm 64, 165-170 cm 59, 170-175 cm 54, 175 cm above 60 (in this case, however, it is better to ask “physical” than “physical” to see clear dependence).
Figure 89 shows the average of self-rated self-sizes by BMI. BMI18-20 peaks at 75 minutes; 18 under 64 minutes. When BMI is above 20, the higher the BMI, the lower the body self rating, the greater the 18.
Figure 90 illustrates the relationship between the degree of shame on greening and the average self-rated, actual BMI. The more people feel ashamed of being green, the lower they rate their body. The average body size of those who feel ashamed is 47, and those who feel ashamed are 65. On the other hand, the average score for those without greening experience is 63, which is higher. The actual BMI, however, does not differ as much as the self-rated, with the average of 21.8 for those with a sense of shame, 21.0 for those without a sense of shame, and only around 1.
Figure 91 shows the self-scoring of self-playing by 131 effective respondents who answer that they are inside performer. 9% answer “Don't know”; among the scorers, “61-70” is the highest, with an average of 51 points.
Figure 92 shows the relationship between shame on greening and the average of self-rated performances. The more you feel ashamed, the less you rate yourself. The average score of those who feel ashamed is 36, while those who feel ashamed are 62.
Figure 93 shows the relationship between “pure photo fairs” “talking with peers” “acts such as adult/love” “and the selection of the most attractive areas in the general population,” and the average of self-styled self-playing scores. The selection of “with the general population greening” has a high body and performance self-scoring rating of 67 and 65, respectively; the selection of the other options is 54-56 and an exercise of 44-48.
Figure 94 shows the relationship between participation in off meetings and open activity frequency and self-playing. In either case, there is no difference between two or more times a month and about half a year, about 60 minutes. However, the self-scoring rate fell to about 50 per year; the average of lower-frequency people fell to 40.
Table 12 shows the results of these self-scorings by region. There are no significant regional differences in the (highest) form of the mother-in-law, but the (lowest) form of the mother-in-law is higher in Kansai and overseas, with an average of 80 points recorded, especially abroad. Self-scoring of “self-style” “self-playing” is higher in Kansai and overseas. The performance self-scoring is low at the local level.
Figure 95 shows the distribution of a sense of pride in Kigurumi's hobby and the self-playing rating. The more proud people, the more they tend to give themselves high marks. The average is: "Be proud" 59, "Most be proud" 55, "Not very proud" 45, "No pride at all" 43.
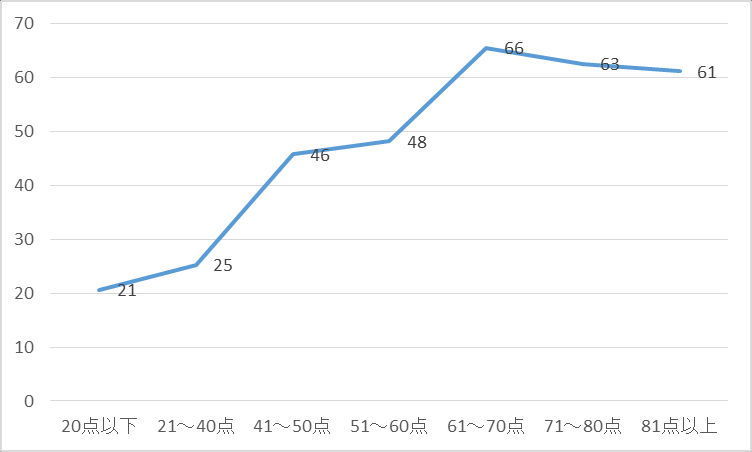
Figure 96 Shows the relationship between body self-scoring (cross-axis) and performance self-scoring averages (cross-axis). The higher the body self-scoring, the higher the performance self-scoring, the higher the body self-scoring in the following regions; however, the body self-scoring exceeds the upper limit of 60 and the body self-scoring is no longer relevant to the performance self-scoring.
| Region | Mother's shape (highest) | Mother's make-up (lowest) | Self-physical | Play yourself. |
|---|---|---|---|---|
| Kanto | 90 | 68 | 58 | 48 |
| Tokai | 85 | 65 | 55 | 56 |
| Kansai. | 93 | 74 | 65 | 59 |
| Local (East Japan) | 88 | 67 | 44 | 43 |
| Local (West Japan) | 94 | 71 | 54 | 43 |
| Overseas | 93 | 80 | 65 | 63 |
Table 12: Self-assessment of the home, body and exercise by region min
Figure 85: Self-scoring (highest)
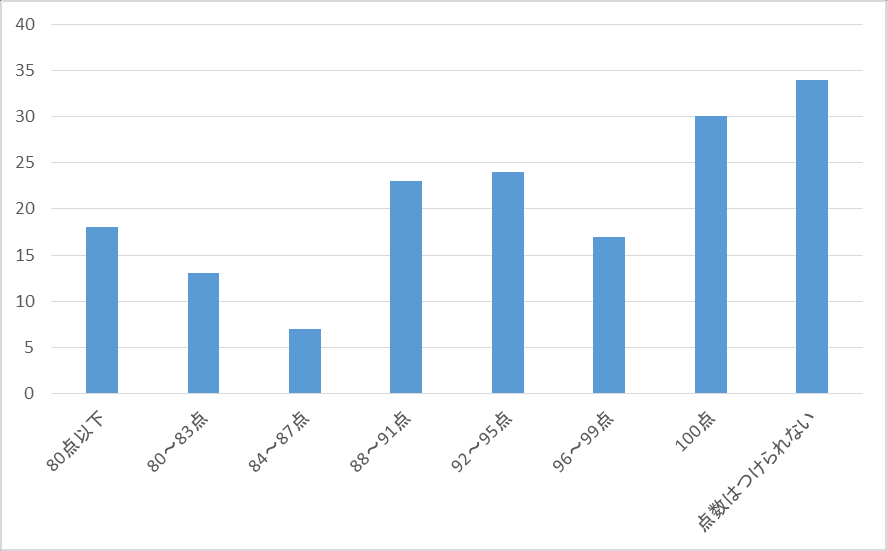 Figure 86: Self-scoring (minimum score)
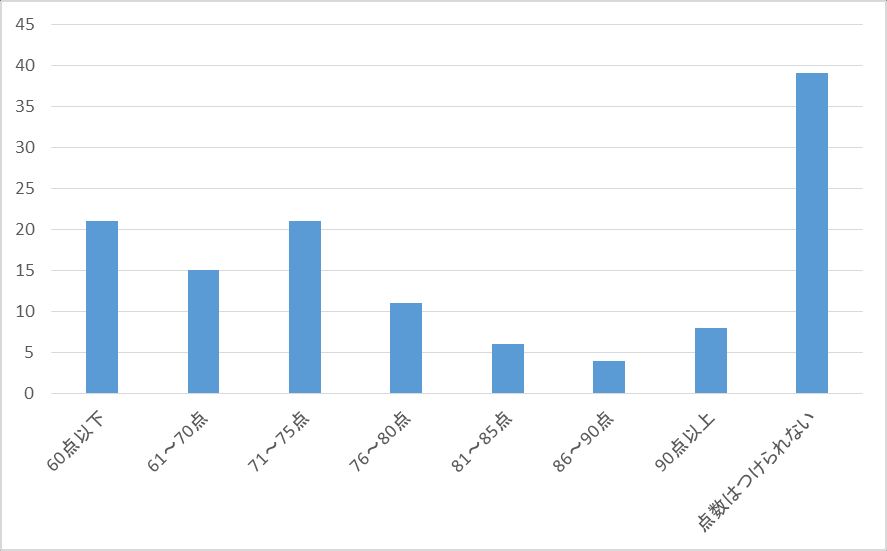 Figure 87: Distribution of homemaking (highest score) by pride in kigurumi
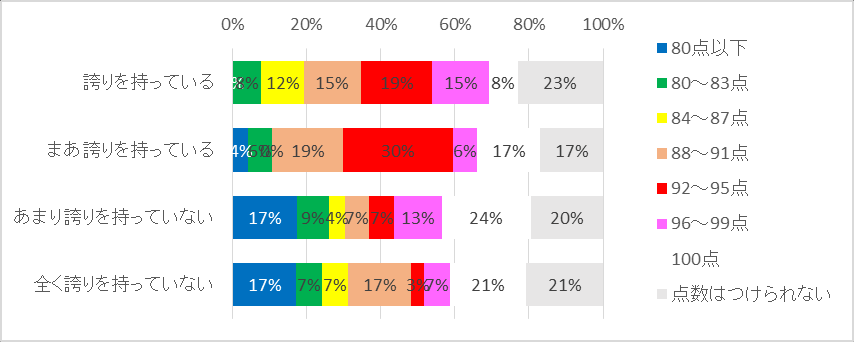 Figure 88: Self-assessment of body type for inside performer min
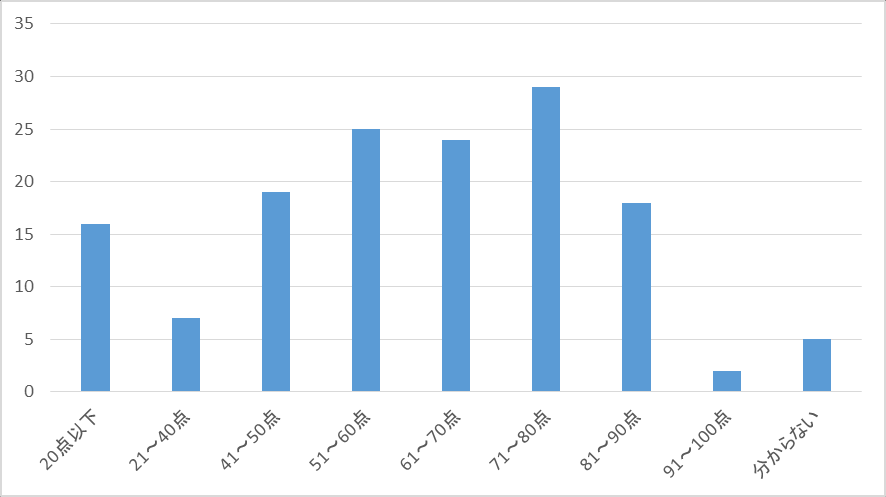 Figure 89: Self-rated body by BMI
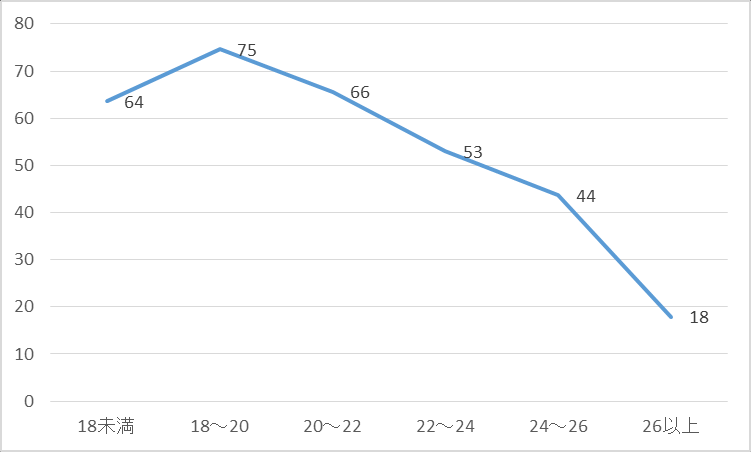 Figure 90: Self-assessment of the body by shame on greening min
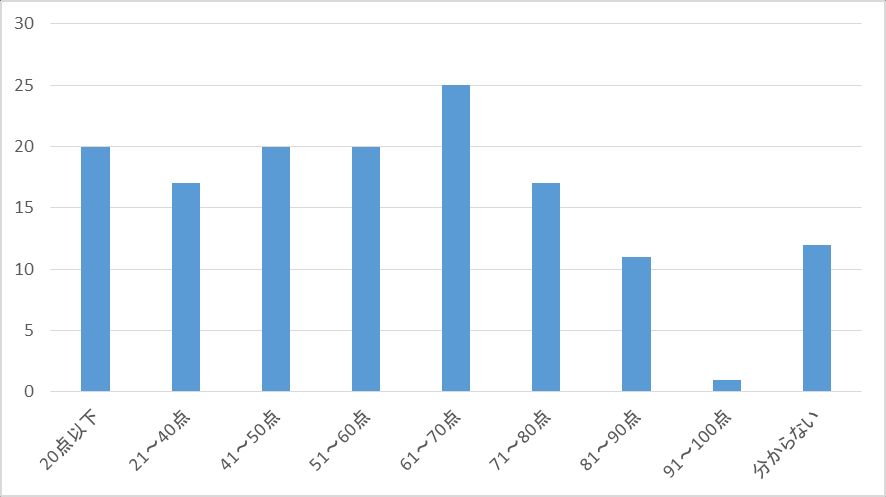 Figure 91: Self-assessment of self-playing min
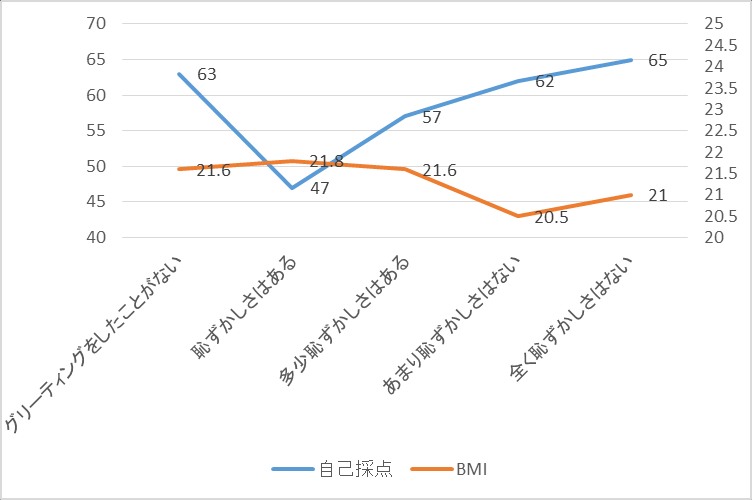 Figure 92: Self-assessment of self-play by shame on greening min
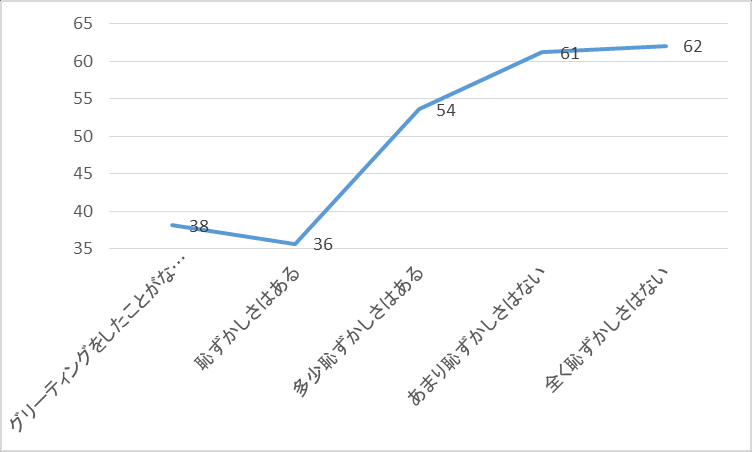 Figure 93: Self-physical and performance self-assessment by kigurumi glamour min
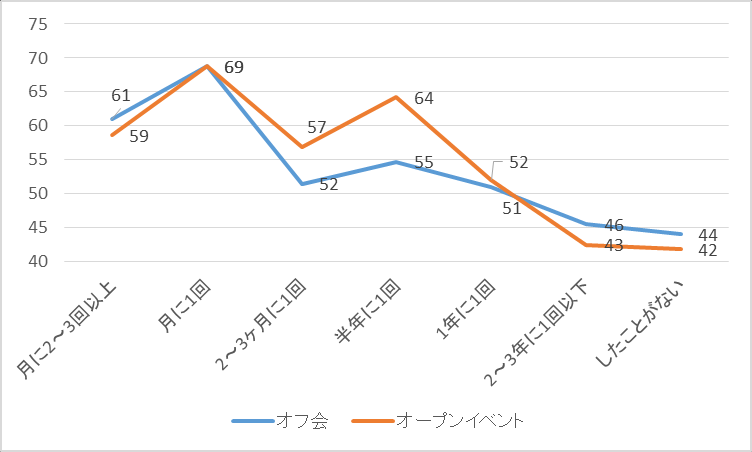 Figure 94: Participation in off-board/open activity frequency and self-rated self-playing
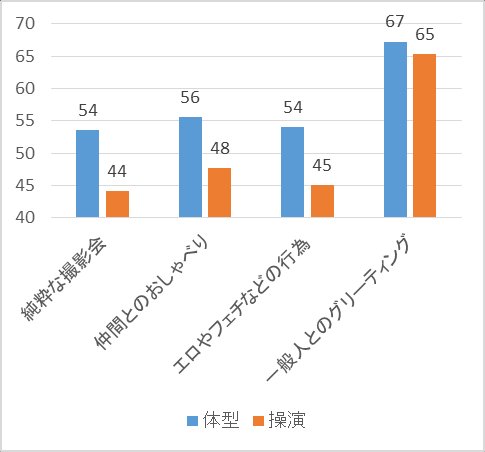 Figure 95: Distribution of self-rated performances by pride in Kigurumi preferences
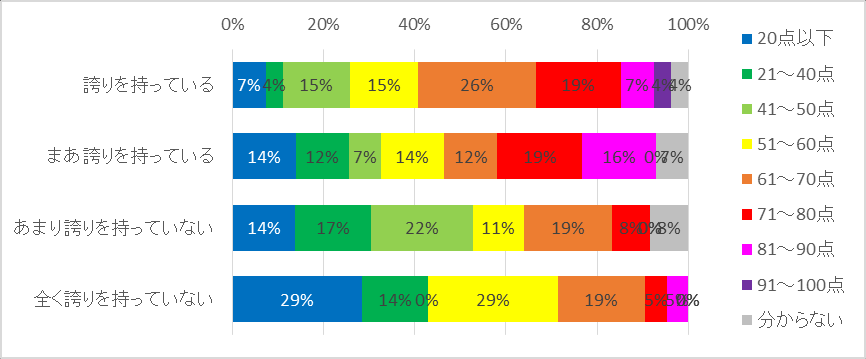 Figure 96: Average body self-scoring and performance self-scoring
30. Perceptions of having no role love but welcoming the role, not fit, but wearing
Figure 97 shows the views of 197 effective respondents on the “showing/receiving role for reasons of humanism, co-production, etc., even if there is no particularly strong role love”. "I think it's all right." The positive answer is 67 percent. Figure 98 shows the views of 198 valid respondents on the issue of “a non-conformity but a role in kigurumi”. The answer is certainly 57%.
Figure 99 shows the perception of having no role love, by year of activity. Answers will certainly prevail up to the seventh year, but negative answers will increase slightly after the seventh year.
Figure 100 illustrates the perception of unsuited size by length of activity. The proportion of respondents for 3-7 years is certain to be extremely high; the younger they are or the longer they are, the higher the proportion of negative respondents. In particular, the proportion of negative answers exceeded the number of positive answers for those over 15 years.
Figure 101 shows the perception of having no role love but welcoming it by the number of available places. No explicit reliance was seen. However, among those with 7 body sizes above, the choice is higher, at 28 per cent; on the other hand, the negative answer is more than 40 per cent.
Figure 102 Shows the perception of body-type incompetence by body-type self-rating. The more people rate their body, the more they prefer negative answers. In particular, the negative answer exceeded the affirmative answer for those who gave more than 81 points. On the other hand, even among those with more than 81 points, the proportion of opting for “more than completely” is as high as 19 per cent.
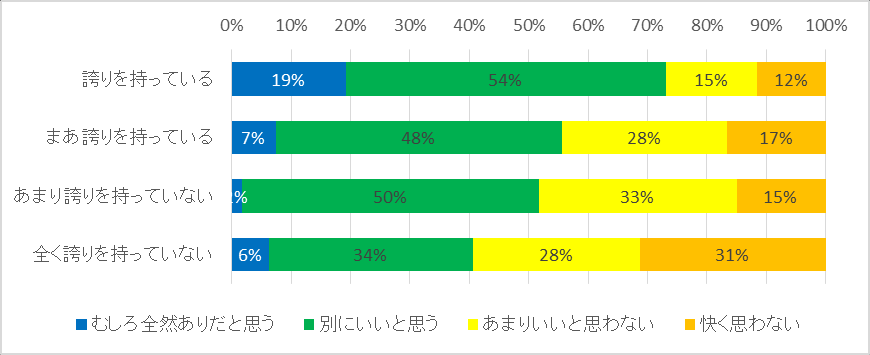
Figure 103 shows the relationship between a sense of pride in kigurumi's hobby and a perception of a different size but a better dress. The more proud, the more positive the answer; the less proud the less the answer. It should be noted that this tendency does not appear in the perception of “no role love but welcome”.
Figure 97: Views received without role love
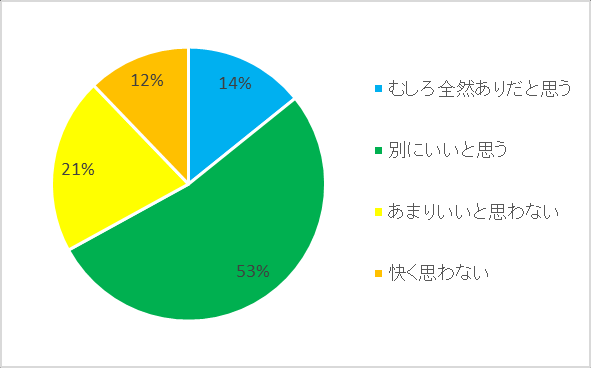 Figure 98: Perceptions of non-conformity
 Figure 99: Perceptions of having no role love, by length of activity
 Figure 100: Perceptions of non-conformity by length of activity
 Figure 101: Perceptions of having no role love but welcoming it by face count
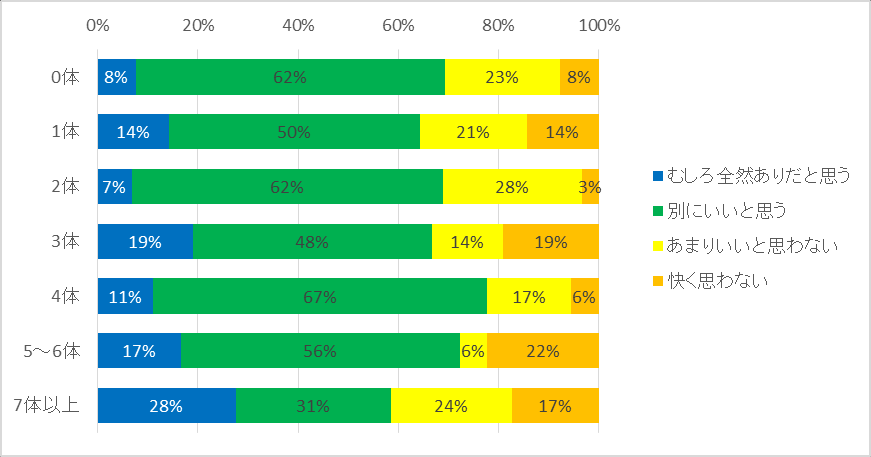 Figure 102: Perceptions of non-conformity and wearing by body self-rating
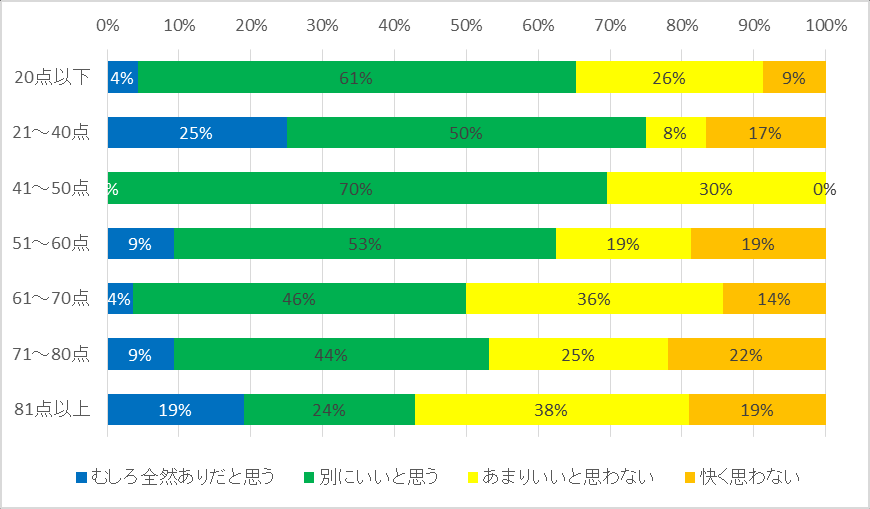 Figure 103: Perceptions of non-conformity and wearing by pride in kigurumi preferences
Views on the “playing role”
Figure 104 shows the views of 202 effective respondents on the “crash role”. “I care” is 36%, “I care less”, 62%, and I care more than I care. Here's the “crash role” which means that Kigurumi, the same actor, is owned by different people.
Figure 105 illustrates the perception of “hit role” by region. In the three major urban circles, there is a similar tendency to be intuitive and uninvolved. Local (East Japan/West Japan) do not care more. Overseas, there is more to the mind than to the mind.
Figure 106 illustrates the perception of the “playing role” by year of activity. Basically, the younger the younger, the less aware the longer the activity is; however, the more 15-year-olds show the opposite, the more “careful” the “negative” the better.
Figure 104: Perceptions of impact roles
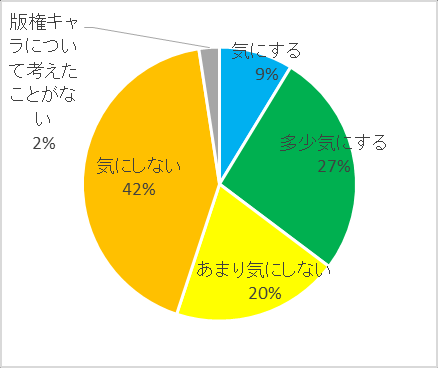 Figure 105: Perceptions of impact roles by region
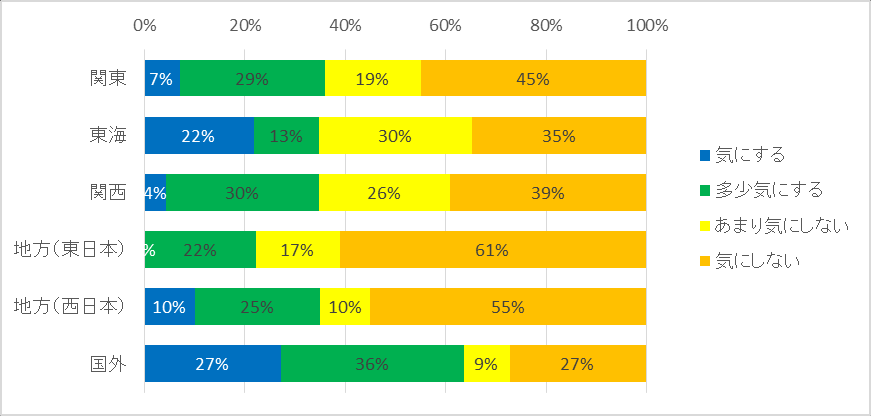 Figure 106: Percussion of impact roles by activity years
32. 对着ぐるみ“恐怖感”的看法
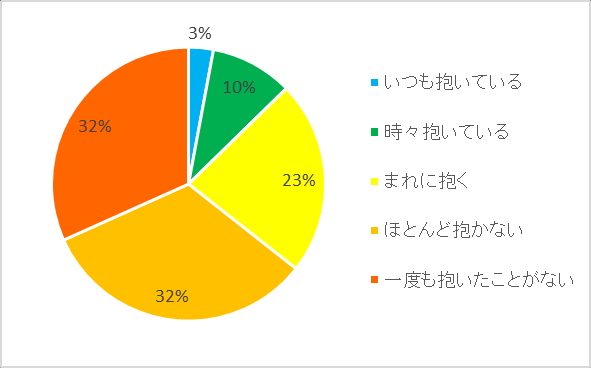
Figure 107 shows the views of 205 valid respondents as to whether “a `horrifying' feeling of Kigurumi would occur”. The answer is "there is always" and "sometimes there is" — that is, 13 percent of people who often feel terrible. The answer to “sometimes there” is 23%. “nearly” “never” is 64 per cent of those who probably do not understand the intent of the problem.
The survey of how proud of Kigurumi's hobby is in relation to the answer to the question, “there is always” the proportion of “sometimes” “sometimes”, 6 per cent of “proud” and 29 per cent of “no pride”. The more you don't like kigurumi, the more you're afraid.
Figure 107: Is there a view of Kigurumi's “horrifying” feelings?
33. Perspectives on the future of the female population in the future
Figure 108 shows the response of 203 effective respondents to “Does the population want to increase in the circle” The answer to “hope” was 61 per cent. The “maintenance of the status quo” is just 29 per cent and the “lower” is 10 per cent.
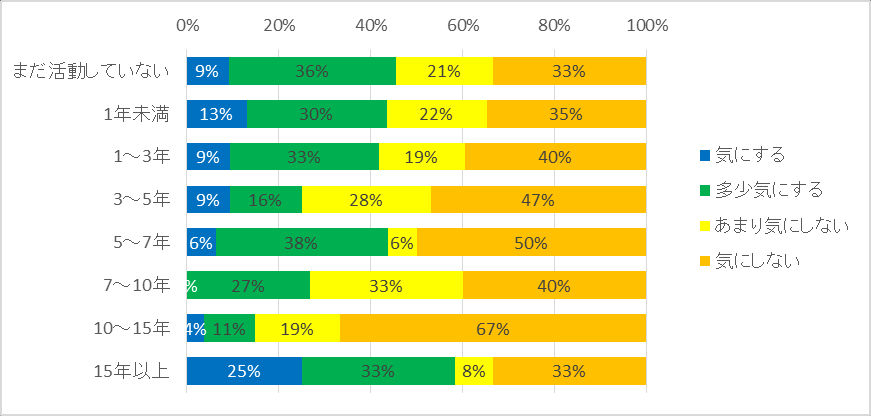
Figure 109 shows the responses by year of activity. The answer to “how much hope” has remained almost unchanged at the level of years of activity, but “who, on the contrary, wants to reduce” the tendency of those who have been older in their activities to choose.
Figure 110 illustrates the relationship between a sense of pride in kigurumi and a desire to increase the population in the circle. The more proud of Kigurumi's hobby, the more you want the population to grow. Among those who answered “with pride”, “hope” was 72 per cent; while “no pride at all” was only 41 per cent.
Figure 111 shows responses by region. Kanto “Hope” is 50 per cent, and the rest is over 60 per cent. Particularly overseas, “Hope” is close to 80 per cent. On the other hand, the Tokai is not “too much hope”, but the answer to “hope” is more, 55 per cent, the highest in all regions. In addition, no one in the region has chosen “to wish for less”.
Figure 112 shows the response of 207 effective respondents, including “Don't know”, to “Does it want to increase the number of women in the circle” The sum of “Hope” is 60 per cent. The “unwanted” “does not want” is 22 per cent and the “not know” is 18 per cent. In addition, 6 women replied: “Hope”, 44 per cent; “How much hope”, 22 per cent; and “Don't know”, 33 per cent.
Figure 113 shows the responses by year of activity. Until 15 years, there were fewer differences in the length of the activity; however, 58 per cent of those 15 years or more were “hope” and 75 per cent responded positively.
Figure 114 shows the relationship between a sense of pride in Kigurumi's hobby and a desire for women to enter the circle. "Happiness" has more than 60 percent of the "less pride" level, and only 35 percent of the "no pride at all" level wants women to enter, and the "not knowing" answer has increased.
Figure 115 shows the answers by marriage. Sixty-four percent of married people want women to enter. Many of the people who said, "Even if they quit, they want to get married" wanted to increase the number of women, and 46 percent chose "hope." The answer to the question “If you want to marry if you want to marry” is 33%, but more, 74% of them want women to enter. The answer to the question, “If you can, you want to get married, but you don't think about it”, is that 64% want women to come in, and the word “not know” is more obvious. Among those who answered “but not want to marry”, “not without the desire to marry, but has given up”, there are fewer women wishing to enter, and “how much hope” is less than 40 per cent.
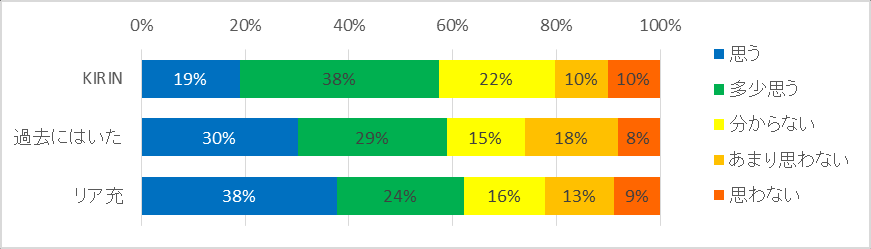
Figure 116 shows the perception of female entry according to past relationships. The more realistic they are, the more they want women to enter. Thirty-eight percent of the full-life people choose Hope. In the past, 30 per cent of the people who had a partner and 19 per cent of the KIRIN had a negative attitude.
Figure 108: Answers to whether the population should increase in circles
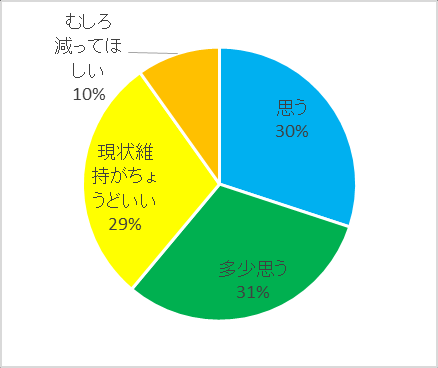 Figure 109: Perspectives on future populations by age of activity
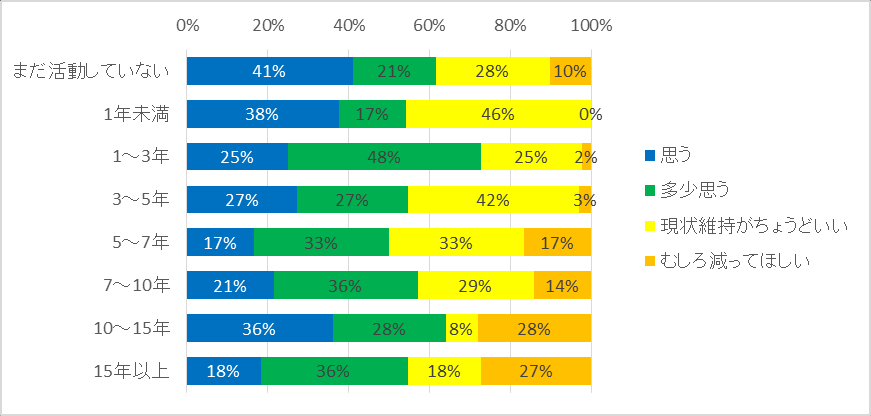 Figure 110: The relationship between pride in Kigurumi's hobby and perceptions of the population in the circle
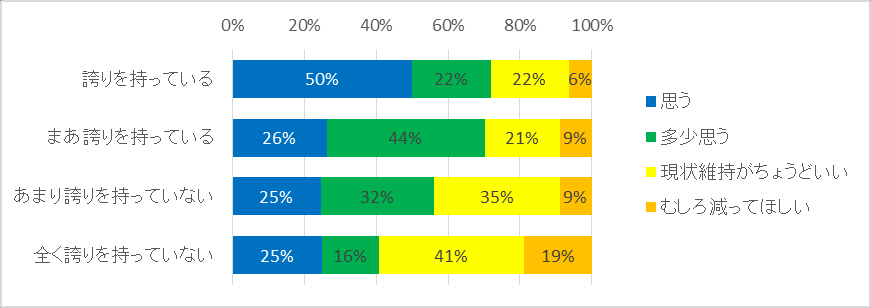 Figure 111: Perspectives by region on whether the population in the circle should increase
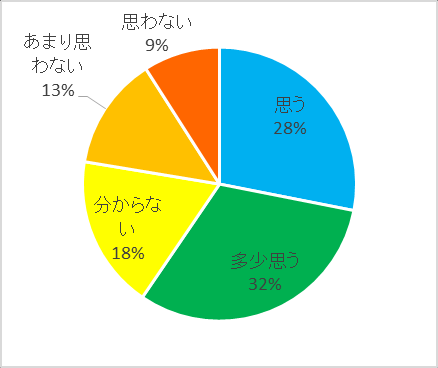 Figure 112: Views on whether there should be more women in the circle
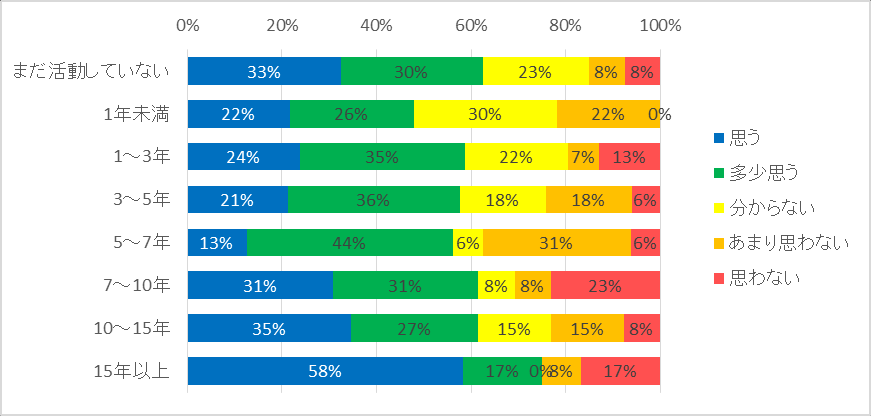 Figure 113: Perceptions of female participation in the circle by length of activity
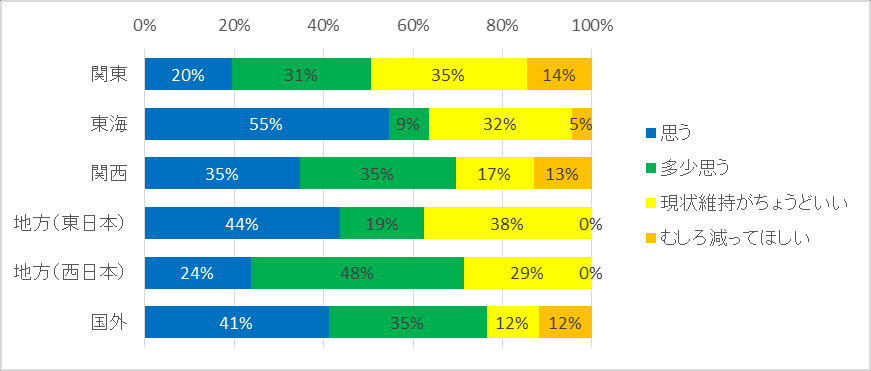 Figure 114: The relationship between pride in kigurumi ' s hobby and perceptions of women entering the circle
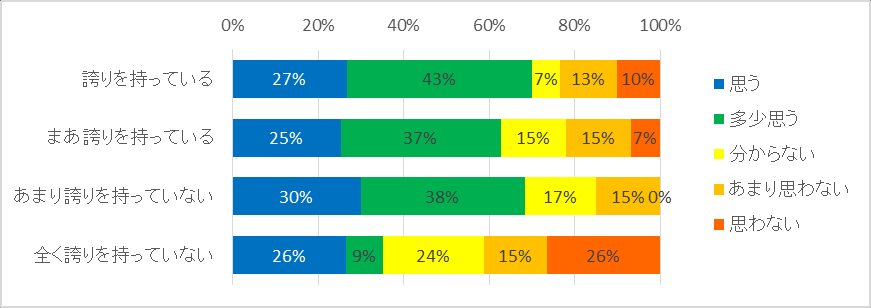 Figure 115: Relationship between marriage and perceptions of women entering the circle
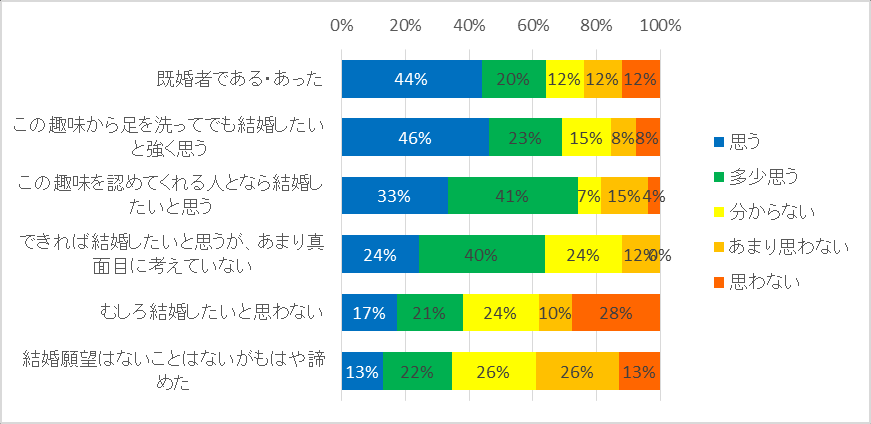 Figure 116: Perceptions of women ' s entry according to previous relationships
34. Views on doll kigurumi, Hashimoto, single-eyed kigurumi
Figure 117 shows the views of 216 valid respondents on doll kigurumi. The affirmative answer to “like” is 61%; if “interested, but distanced” is included, 74% have a good impression.
Figure 118 shows the views of 210 valid respondents on the Hashimoto guy. The positive answer to “like” is in the affirmative, 45 per cent; the negative answer to “like” is 30 per cent. Besides, 12% of the people who don't know about Hashimoto guys.
Figure 119 shows the views of 212 effective respondents on the one-eyed kigurumi of Zilong. The negative answer to “not like” was in favour of 45 per cent; the positive answer to “like” was 39 per cent.
In response to these questions, nine valid female respondents responded as follows: for Doll, 11 per cent “I like”, 44 per cent “I like”, 11 per cent “I don't know”, 11 per cent “I don't like”, 22 per cent “I don't like”, 11 per cent “I don't know”, 22 per cent “I don't know”, 22 per cent “I don't like” and 33 per cent “I don't like” for kigurumi, 11 per cent “I like”, 11 per cent “I like”, 11 per cent “I like” for women, 22 per cent “I don't like” and 33 per cent “I don't like”. Overall, women are more likely than men to give negative answers.
Also, by region, the percentage of positive answers (including “to keep distance because of women”) given to doll is about 70 per cent in Japan and over 90 per cent abroad. The same goes for Hashimoto, who must have answered about 40 per cent in Japan and about 25 per cent in the negative; and overseas, who must have answered 70 per cent, indicating that they are more acceptable abroad than in Japan. The tendency of one-eyed women is less different at home and abroad.
Figure 120 shows the relationship between the view of doll kigurumi and that of Hashimoto. The answer to "likes" was 50% for "likes" and 32% for "likes". On the other hand, even if there was a positive answer to doll kigurumi, 10-20 percent of the people gave a negative answer to Hashimoto.
Figure 121 shows the view of kigurumi by year of activity. The longer the activities are known, the higher the negative perception of doll kigurumi. In particular, for those over 15 years, the sum of “not likes” exceeds the sum of “likes”.
Figure 122 shows whether a sense of pride in kigurumi's hobby is related to a view of doll kigurumi. The more proud the answer is, the more positive it is for doll is kigurumi.
Figure 117: Views on doll kigurumi
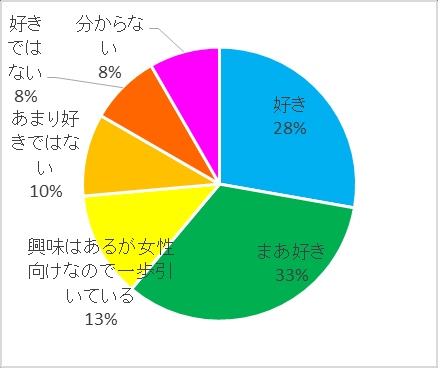 Figure 118: Perspectives on Hashimoto Boys
 Figure 119: Views on single-eyed kigurumi
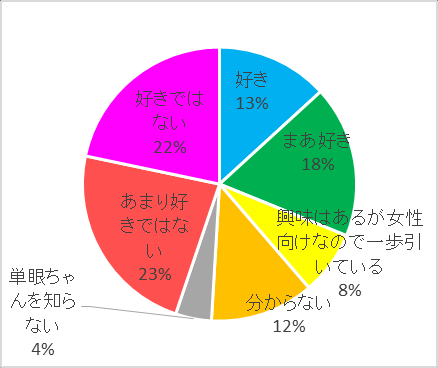 Figure 120: The relationship between the view of doll is kigurumi and that of Hashimoto.
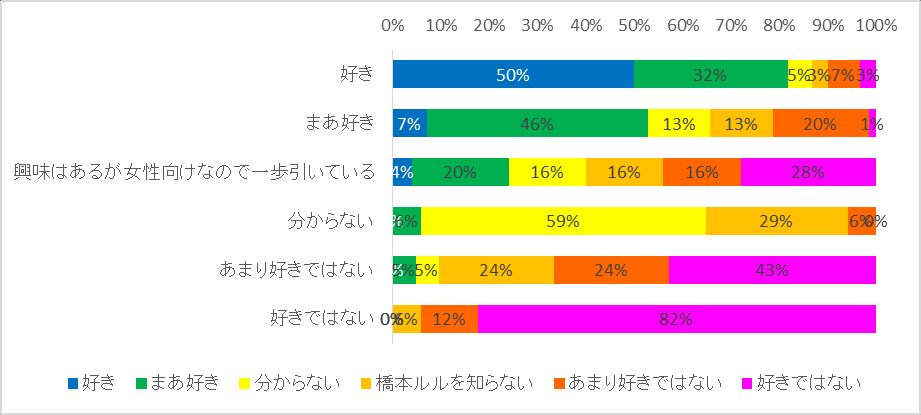 Figure 121: Views on kigurumi by length of activity
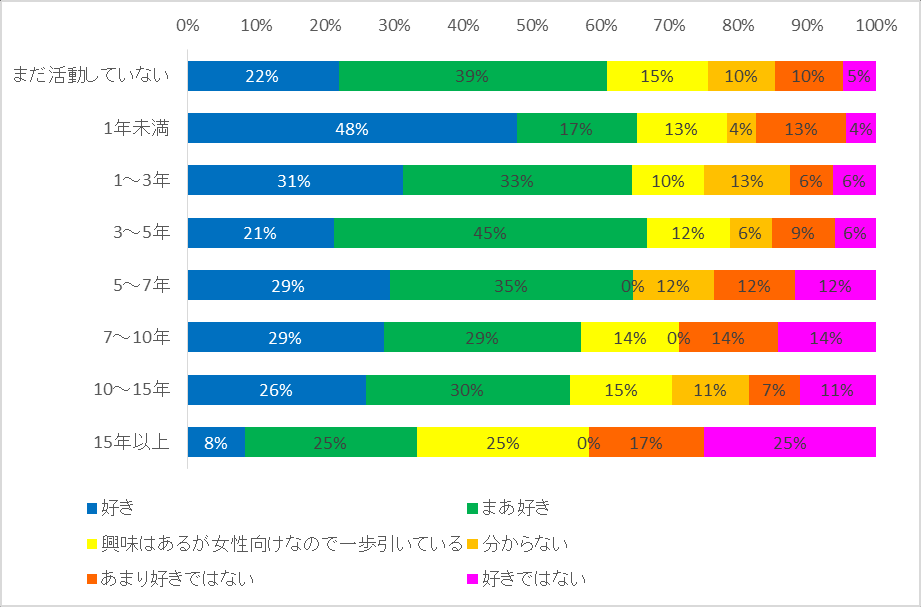 Figure 122: Views on kigurumi by pride in kigurumi preferences
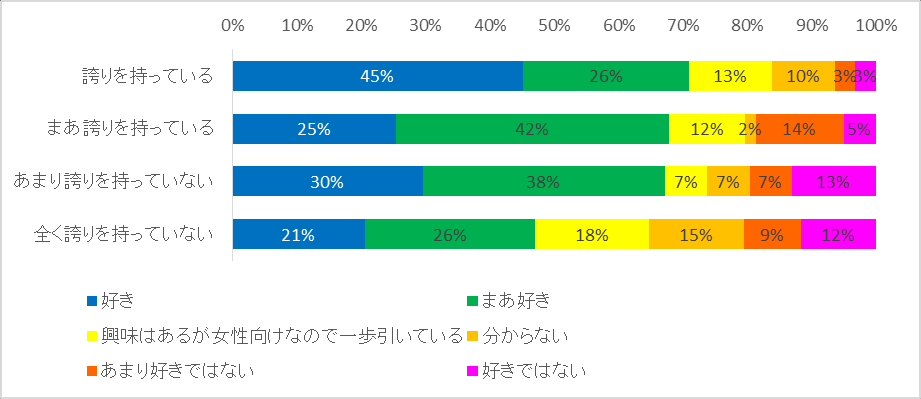
35. Are you proud of Kigurumi?
Figure 123 Activity-only shows the view of 160 effective respondents as to whether they “are proud of kigurumi”. The result is almost half. There is no difference in the length of activity. (If anyone has read this carefully, it should have been noted that I have used the answer to this question in my various analysis. The reason for this is that the answer is almost fairly divided into four-point points, and I find that it often shows a beautiful correlation in all the questions.
Figure 124 shows the view of the activists by region. Overseas must have answered most, nearly 80 percent of the affirmative answer. Next, Kansai, there must be more answers than negative answers. In Kanto, Donghai, and elsewhere (West Japan), there must be a negative answer. At the local level (East Japan), the negative answer is 70 per cent.
Figure 125 shows this relationship by length of activity, but no explicit reliance was found. However, as shown in the figure, the age-based survey of the answer to the question shows that the older one tends to be proud of it.
Figure 123: Do activists feel proud of kigurumi
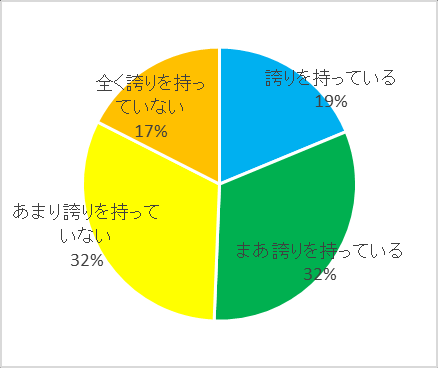 Figure 124: pride in kigurumi preferences, by region
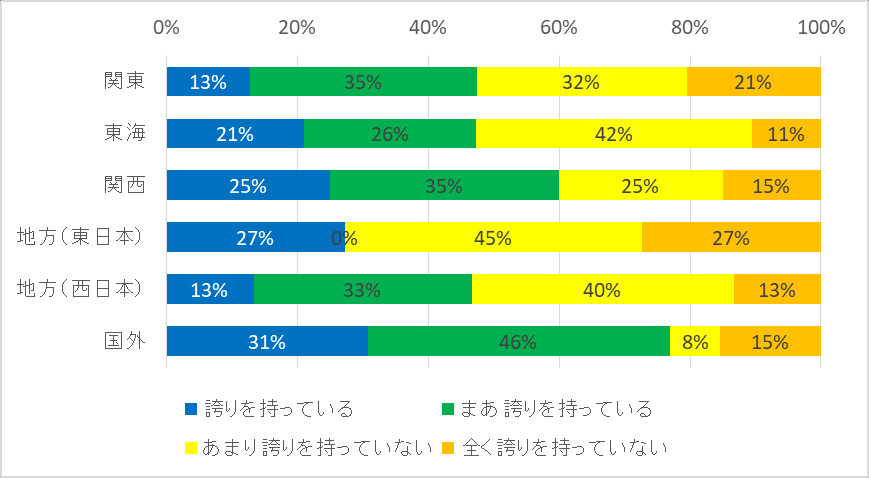 Figure 125: Degree of pride in Kigurumi ' s hobby by length of activity
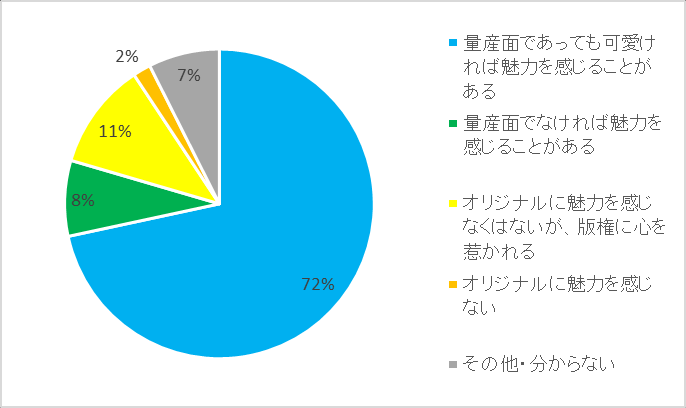 Figure 126: Age-based pride in kigurumi
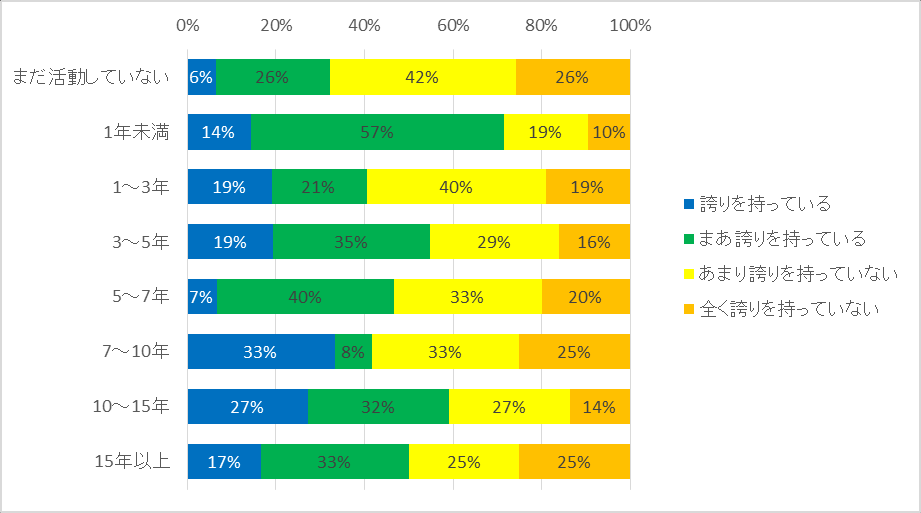
36. Views on original and copyrighted face
Figure 127 shows the views of 199 effective respondents on original and copyrighted surfaces. “Even if it is a matter of volume, it is the most attractive, 72 per cent; “if it is not a matter of volume”, 8 per cent; and “not as attractive as original, but attracted by the role of copyright”, 11 per cent. It's only 2%. There is no special difference between the length of activity.
Figure 127: Perspectives on original and copyright
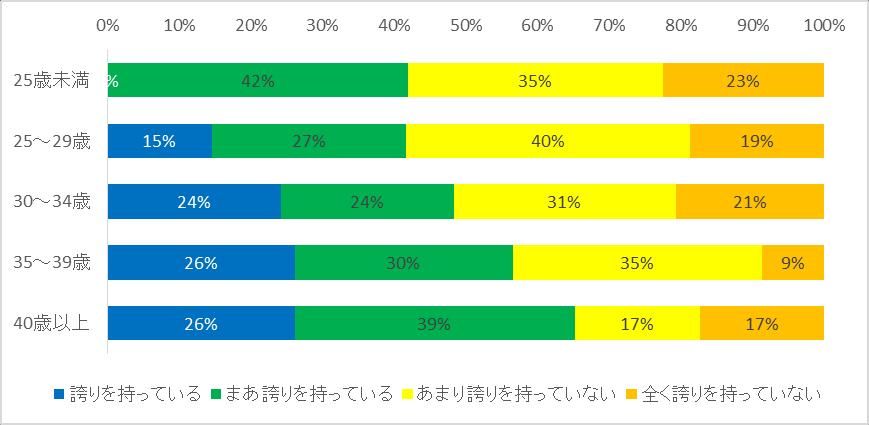
37. Views on the difference between cosplay and kigurumi
Figure 128 shows 200 valid respondents choosing the answer to the difference between cosplay and kigurumi from the three “hidden/anonymous” roles of “realistic” inside performers”. The proportion of “actors' hidden/anonymous” and “role regenerative” is the same, at 38 per cent; the proportion of people who choose “love” is 24 per cent.
Figure 129 shows the responses by activity pattern. 48% of the people who choose "activated or off to wear kigurumi" choose "role recurrence". The “photographic/support specialist” figure is 35%. On the other hand, only 24 per cent of those who “mainly wear alone” choose, and only 9 per cent of those who “not yet active” choose; the proportion who choose “love” is 44 per cent and 33 per cent, respectively, higher.
In addition, by region, there are little regional variations in Japan; however, the proportion of overseas candidates who choose “role replicability” is very high, at over 70 per cent.
This question can be filled out freely in “others” and the answers are described below as follows: no difference (only proprietors) 3 votes; whether to use one's face as a component; whether to repeat it in a photo or during a make-up period, or whether to repeat it on a continuous basis; Kigurumi on the consplay extension line, where the difference is no meaningful difference; face formation; place of consciousness.
Figure 128: Views on the difference between cosplay and kigurumi
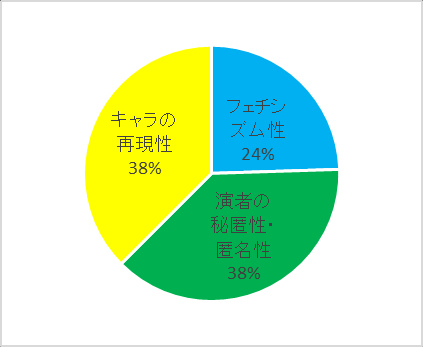 Figure 129: Perceptions of the difference between cosplay and kigurumi by activity pattern
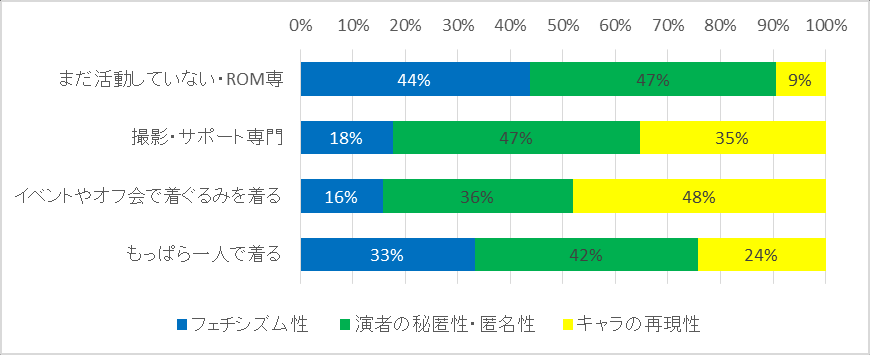
38. Intent to Suu Kyi
Figure 130 shows the intentions of 197 valid respondents, including “not known”, towards Susu. The “no interest in” is 26 per cent, the “no interest in” is 12 per cent and the “no interest in” is 41 per cent. On the other hand, “if the conditions permit, you want to be involved in the luminum” is 24 per cent, “if conditions permit, you would want to be luminum” is 11 per cent, “it is now under consideration” is 4 per cent, and it is positive for luminum, or it is 39 per cent who use kigurumi as an alternative to luminium. Further, 12 per cent of those who are already in the process of doing so are in fact positive about themselves.
Figure 131 shows the responses by year of activity. In general, the length of the activity shows similar characteristics, but only among those over 15 years, the “no interest” is 67 per cent, the majority.
Figure 132 shows responses by region. In the Eastern Circle, there are a very large number of people who are actively interested in Suu Kyi, 23 per cent of whom are actually doing so, and 85 per cent of those who are included in this section are showing a desire to do so.
Figure 130: Intent to Suu Kyi
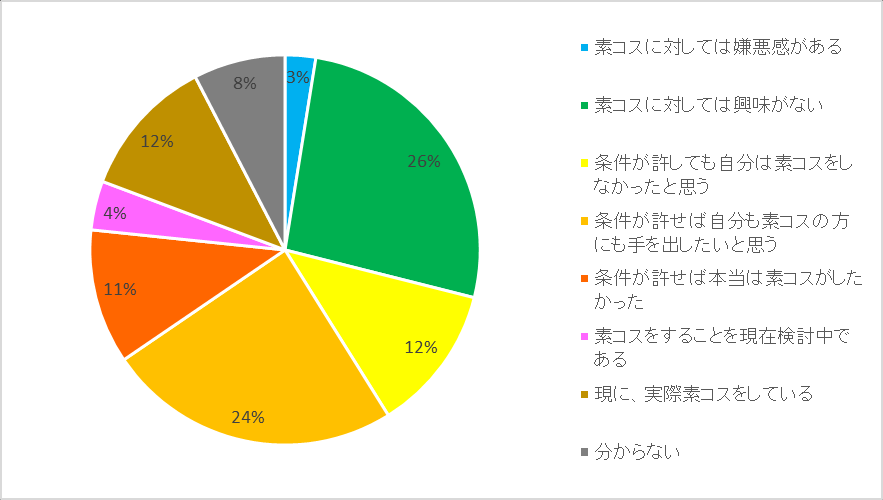 Figure 131: Intents to swathe by length of activity
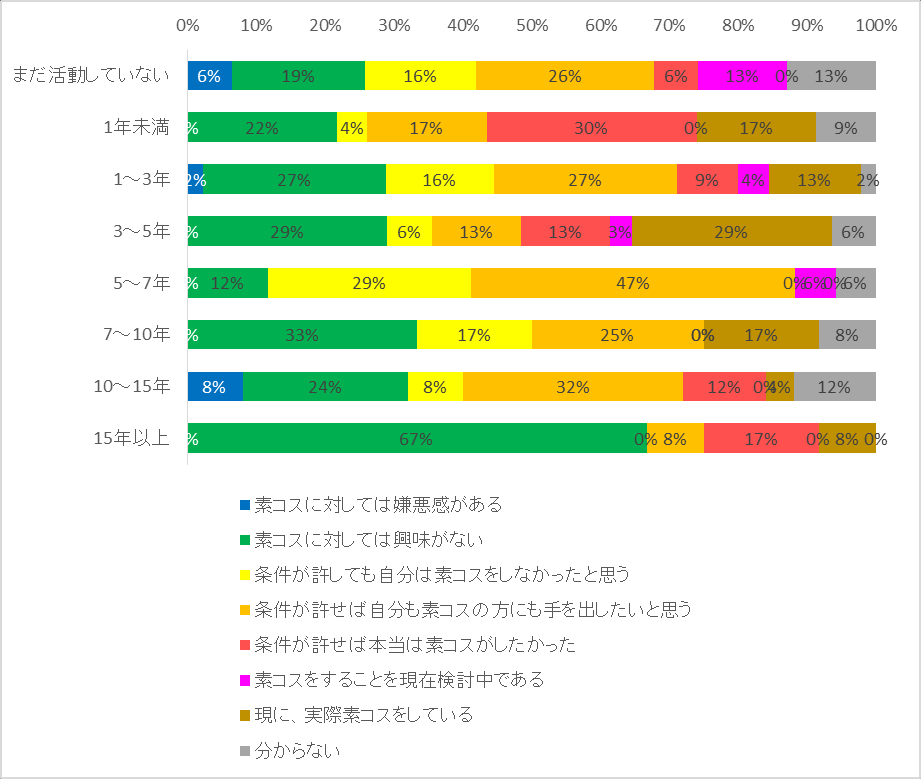 Figure 132: Intents to swaths by region
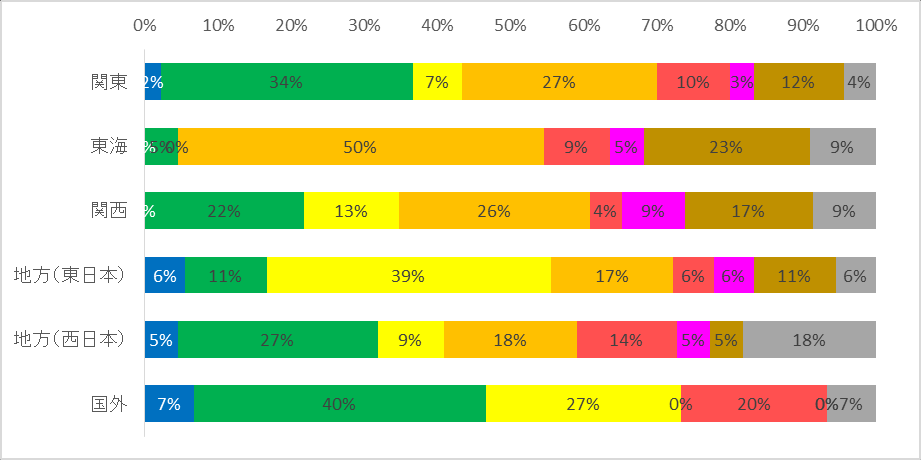
39. The idea of drawing back on yourself
Figure 133 shows the idea of 127 effective respondents who responded that they were inside performer. Most of them are “inside performer until the limit”, which is 40%. “As of a certain age, the personormer status will be withdrawn” is 30%, and “As of a certain age, the person will simply withdraw” is 9%. The answer to the question “not even to consider” was 21 per cent.
Figure 134 illustrates how people, by age, think back. Among those under 25, “inside performer until limit” and “not even thinking of retreat” are roughly equally balanced against each other. At the age of 25-29, the phrase “by a certain age, etc.” “to a certain age, e.g., from inside performer status” amounted to 56 per cent, the phrase “to do inside performer until limit” to 29 per cent, with more negative opinions about continuing as inside performer; however, with age, the phrase “to do inside performer until limit” increased, reaching 72 per cent over 40.
Figure 135 illustrates the relationship between the Kigurumi area of charm and the answer to that question. Among the respondents who chose “pure photo fairs” and “with ordinary people” the advantage was “inside performer until the limit”. Among the respondents who choose “adults/loves, etc.”, the phrase “at a certain age, etc., will be drawn from the inside performer status” and the phrase “will remain in inside performer until the limit”. Among the respondents who choose “challenging with their peers”, half “at a certain age, etc., will be withdrawn from inside performer status”.
Figure 136 shows the relationship between the question of whether there is a difference between the perception of fun/happy levels before and after the kigurumi hobby. The answer to the question "happyer/favourable than thought" suggests that 31 per cent of those who retreat from inside performer status are, and 63 per cent of those who choose "unhappy/favourable." The more fun and happy Kigurumi seems to be, the less he wants to be taken away from his identity.
Figure 137 shows whether a sense of pride in Kigurumi's hobby is related to the answer to that question. Among those who are proud of Kigurumi, “inside performer until the limit” is 57 per cent; the less proud, the more active they are to think back. Among the “total lack of pride”, only 26 per cent are “inside performer until the limit”; “by a certain age, for example, it will simply draw back” and “by a certain age, for example, draw back from inside performer status”, totalling 63 per cent.
Figure 133: Performer's perception of retreat
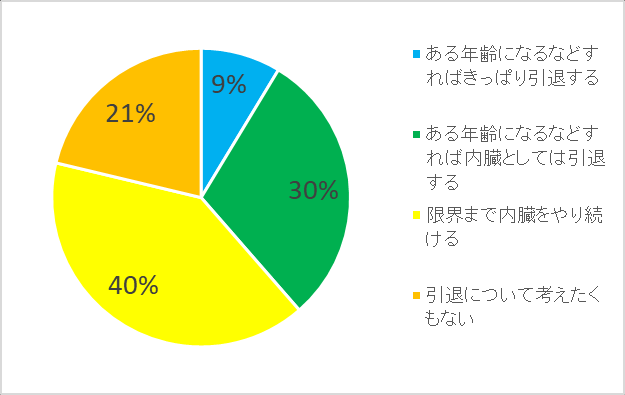 Figure 134: Age-specific reflections on regression
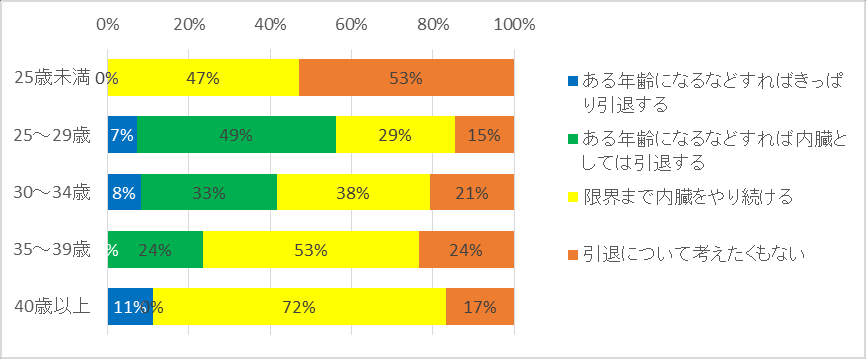 Figure 135: Retrogressive thinking by field of charm
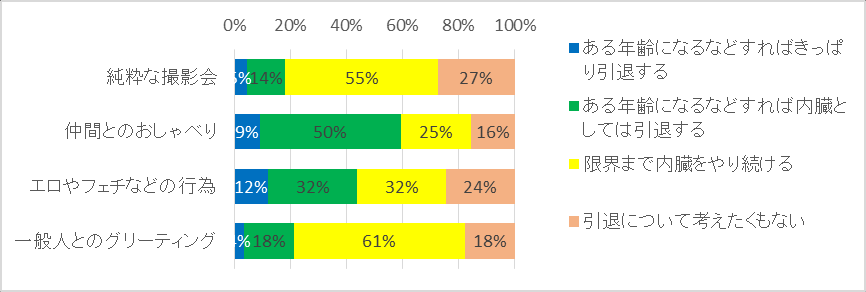 Figure 136: Retrogressive thinking based on kigurumi ' s fun expediency gap
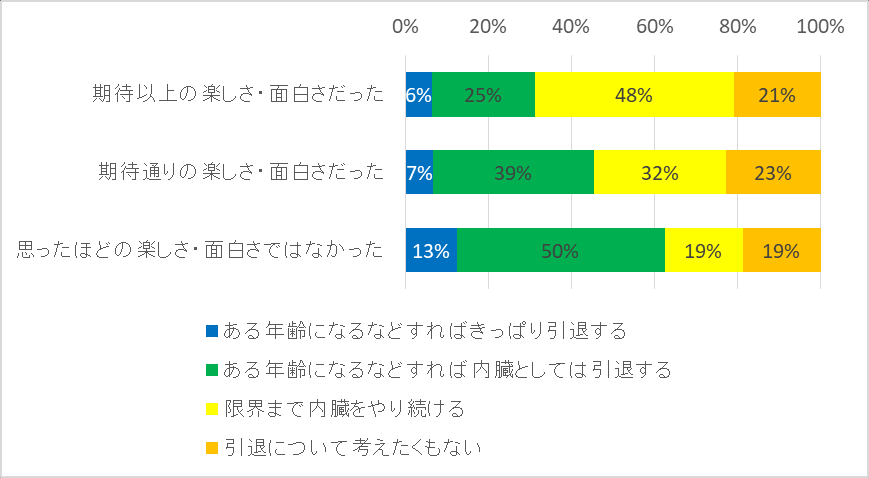 Figure 137: A sense of pride in Kigurumi's hobby and a relationship with the idea of retreat
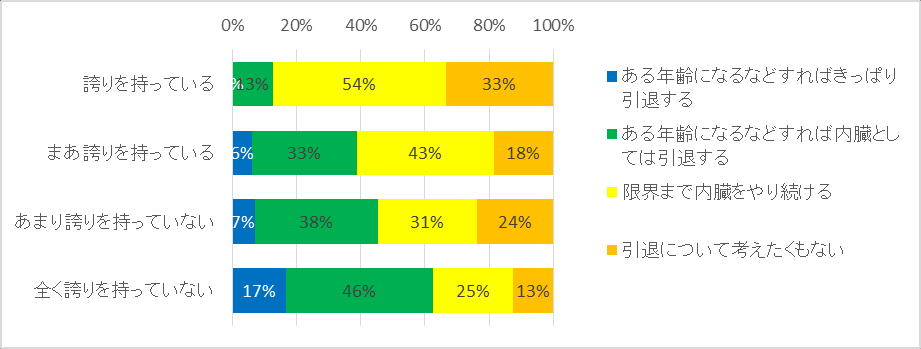
40. Views on whether there should also be an interest outside Kigurumi
Figure 138 shows the responses of 216 valid respondents, including “I don't know”, to “whether there should also be an interest outside Kigurumi.” “If there is only one interest in Kigurumi, it would be less interesting” “I think there must be an interest outside Kigurumi” and “I think it would be better to have an interest outside Kigurumi” totalling 74 per cent, with most suggesting an interest outside Kigurumi. On the other hand, the sound of "even if only kigurumi is interested, it's better than boring" is 20%.
Figure 139 shows the responses by year of activity. Up to 15 years, the years of activity are generally the same; however, no one in 15 years or more has chosen “even if there is only one interest in kigurumi, it is better than boring”; and “I think there must be an interest outside kigurumi” is in the majority, and everyone has suggested an interest outside kigurumi.
Figure 138: Views on whether interest outside Kigurumi should also exist
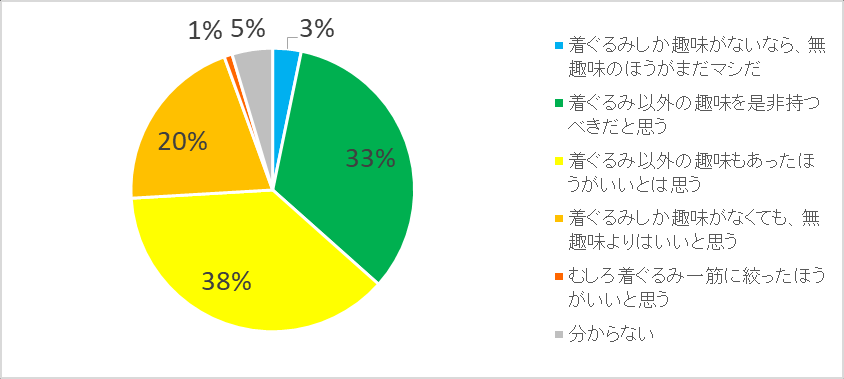 Figure 139: Views on whether interest outside Kigurumi should also exist, by length of activity
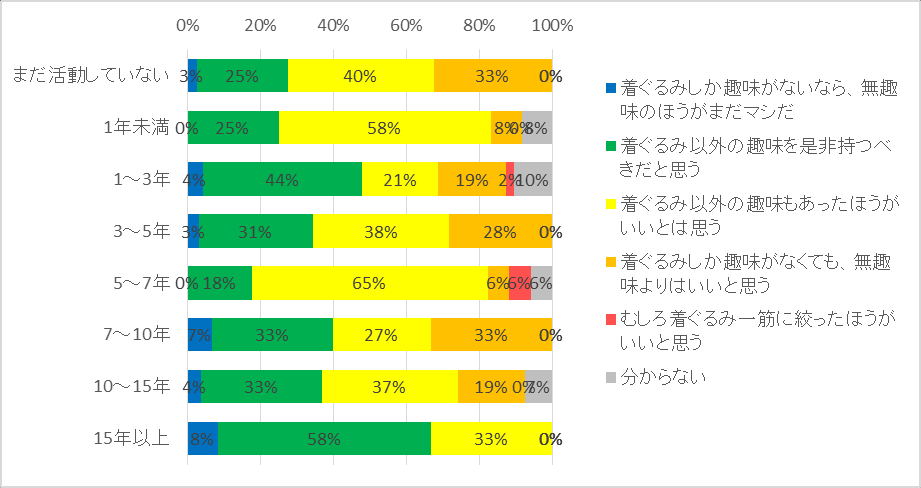
41. The difference between kigurumi ' s hobby and pleasure
Figure 140 shows the responses of 174 effective respondents to “the degree of happiness/interest felt by kigurumi after the actual beginning, and whether it differs from the degree of pleasure/interest that was imagined before the beginning”. And 59 percent of them said, "Happyer than I thought." "Same" is 30%, and "not as happy/favourable" is 11%.
Figure 141 illustrates the relationship between the kigurumi area of charm and the answer to that question. Seventy-seven percent of the respondents who chose "with the average person greening" answered "better than expected." A little less than 60 per cent of respondents opt for “pure photo fairs” “acts of adults/loves, etc.”; 49 per cent choose “chat with peers”.
Figure 142 shows whether a sense of pride in Kigurumi's hobby is relevant to the answer to that question. The more I think Kigurumi is happier and more interesting than I thought, the more proud I am of Kigurumi. Eighty-three percent of the people who answered “with pride” answered “better than they thought;” while only 27 percent of the people who answered “better than they thought” answered “better than they thought”, and 54 percent of the people who answered “better than they thought”.
Figure 143 shows responses by region. By and large, 50-60 percent of the regions answered "happyer than I thought"; but the local (East Japan) negative answer was slightly obvious, with only 33 percent choosing "better than I thought."
Figure 140: Disparities between the level of pleasure/interest of the activists at the start
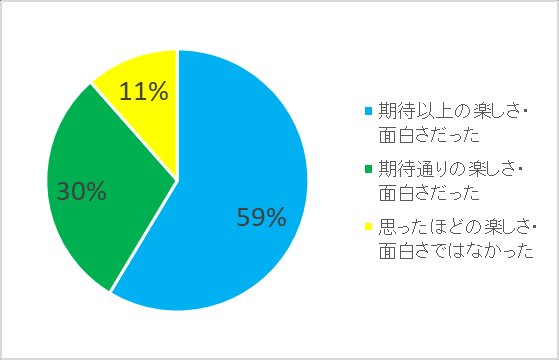 Figure 141: Differences between the kigurumi charisma field and happiness/interest
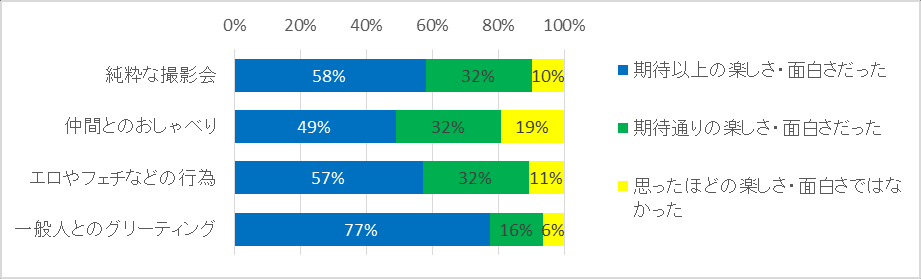 Figure 142: A sense of pride in Kigurumi ' s hobby versus a difference between pleasure/interest
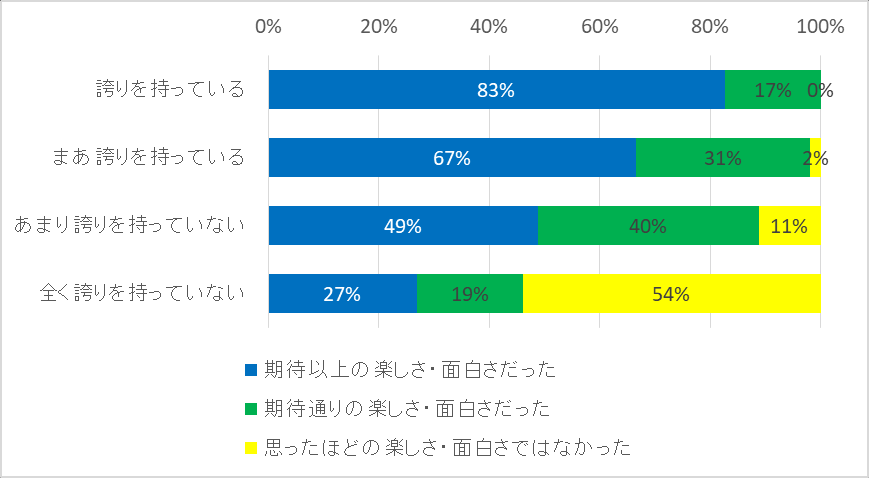 Figure 143: Disparities in the level of happiness/interest of activists by region
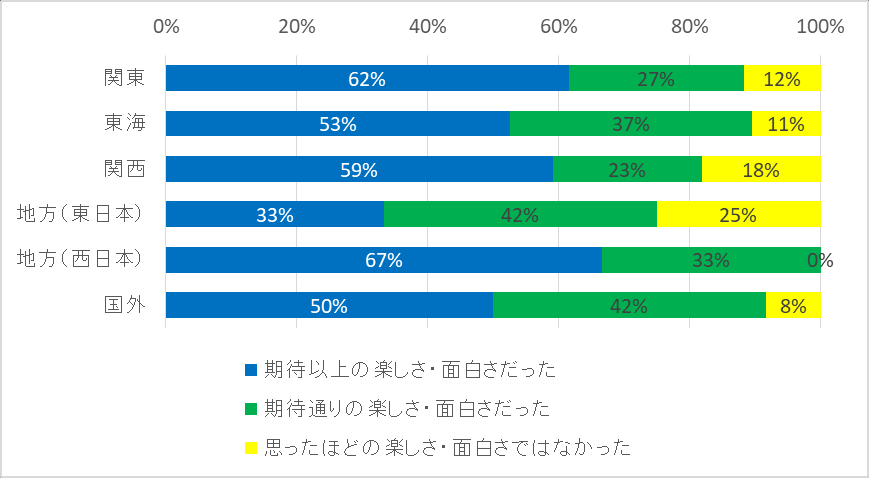
42. Shame on greening Sensor.
Figure 144 shows 145 responses to “Is there a sense of shame in front of people appearing in greening” as effective respondents to inside performer activities. Fifty-nine per cent of the respondents answered “with shame” and “with less shame” with 31 per cent “with no shame at all” and the majority with shame. The answer to "no greening" was 10%.
Figure 145 shows the relationship between a sense of pride in Kigurumi's hobby and a feeling of shame about growing. The more proud people are of kigurumi, the less ashamed they are of being in the greening. Forty-six percent of the people who answered "with pride" answered "with no shame at all," and 52 percent of the people who answered "with no pride at all" answered "with shame." Moreover, the less proud the less they are, the less they are able to participate in activities that are greening.
Figure 146 After excluding those who did not participate in a cosplay that could be given, the responses by region are shown. By and large, about 70 percent of the regions said, "A little shame," "A little shame," and in the west, only 42 percent of the people who chose "A little shame," 50 percent said, "A little shame."
The answer to this question is based on the frequency of participation in cosplay events that can be carried out on the streets and so on. Seventy percent of those who attend at least once a month say, "No shame at all." The lower the frequency of the event, the more the "smugness" answers; about 60% of those below the frequency per year answer "smuggling" "smuggling."
Figure 148 shows the answer to that question by year of activity. The longer you get, the less ashamed you get. Of those under 1 year old, 93 per cent said, "A little shame," and 55 per cent of those over 15 years, "A little shame," "no shame at all."
In addition, when observing inside performer's question in the context of kigurumi's charm, among those who chose “with the general population,” “more or less shame” 30 per cent, “not much shame” 23 per cent and “no shame at all” 47 per cent. Among those who choose “pure photography” the sum of “too much shame” is 80%, the sum of “less shame” is only 12%; the sum of “no shame” is 8%. The selection of "talking with peers" is 62% for 31% and "doing nothing" 8%. The selection of “adults/loves, etc.” was 63% for 16% and “no greening” 22%. It is known that many people have a sense of shame except for choosing “with the general population”.
Figure 144: Shame on greening Sensor.
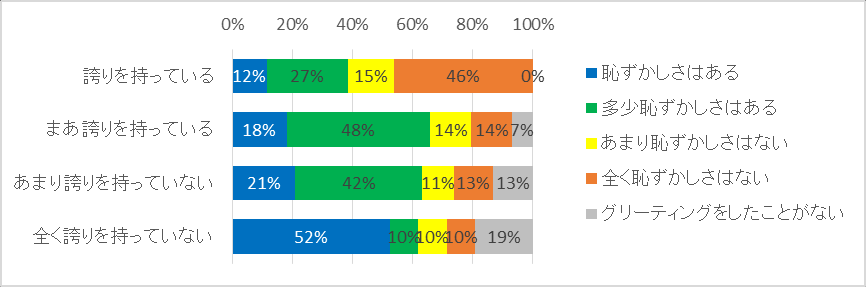 Figure 145: A sense of pride in Kigurumi's hobby and a sense of shame about growing
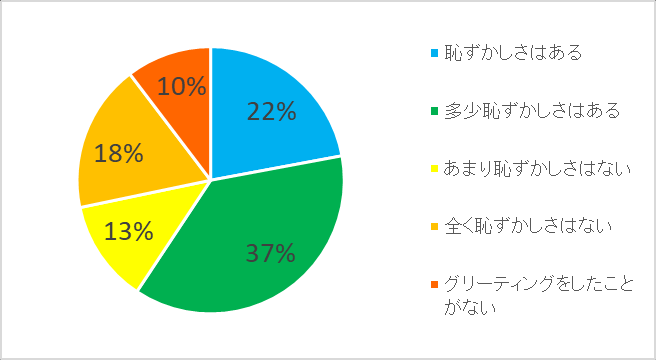 Figure 146: Response to growing shame by region
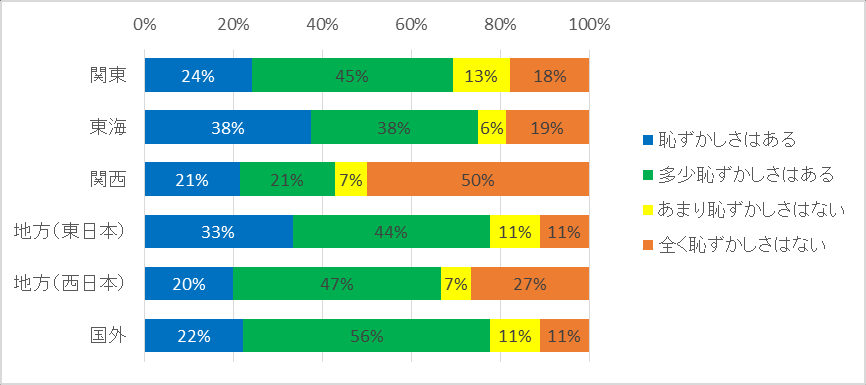 Figure 147: Answers to growing shame by frequency of participation in open events
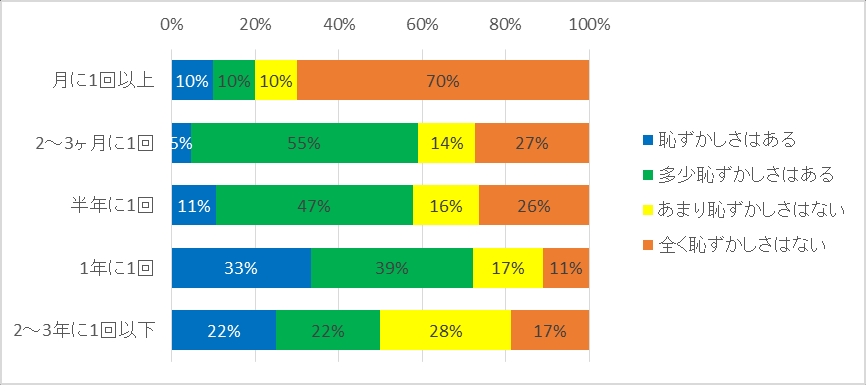 Figure 148: Answers to growing shame by length of activity
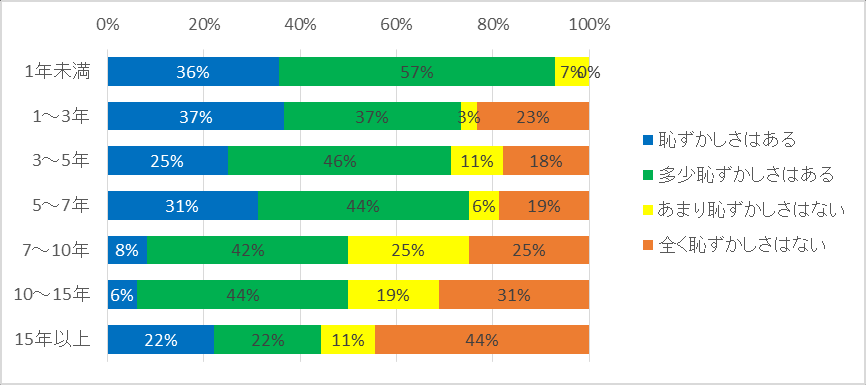
43. Views on kigurumi ' s preference for social recognition
Figure 149 shows the response of 197 valid respondents to “Whether Kigurumi prefers more social recognition”. “I want more social recognition” is 15 per cent, “I want more social recognition” is 23 per cent, “maintaining the status quo” is just 44 per cent, and “more so” is 18 per cent.
Figure 150 shows the answer to the question by the kigurumi field of charm. Sixty-five per cent of those who chose “with the general population” wanted to be recognized by society, and only 3 per cent of those who chose “better” than “better” now. And 43 percent of the people who chose "pure photo fairs" wanted to be recognized. However, only 24 per cent of those who choose “talking to their peers” want social recognition; only 23 per cent of those who choose “adults/loves, etc.” want social recognition, and 29 per cent think that “not so much now” does not want social recognition.
Figure 151 shows the answer to that question by year of activity. Although it is not possible to grasp a clear trend, there are slightly more people in 5-10 years who think that “it is better to say that” than in other years.
Figure 149: Respondent ' s perception of kigurumi ' s preference for social recognition
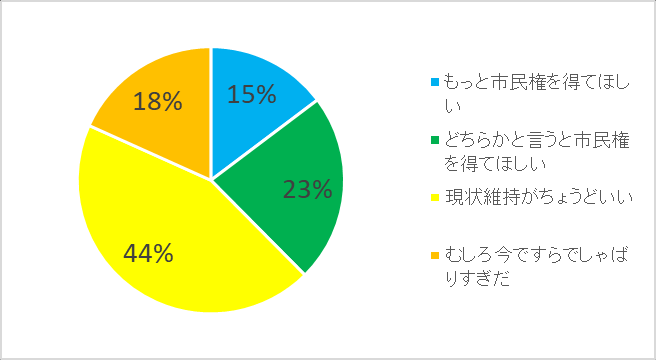 Figure 150: Socially recognized perceptions by kigurumi area of charm
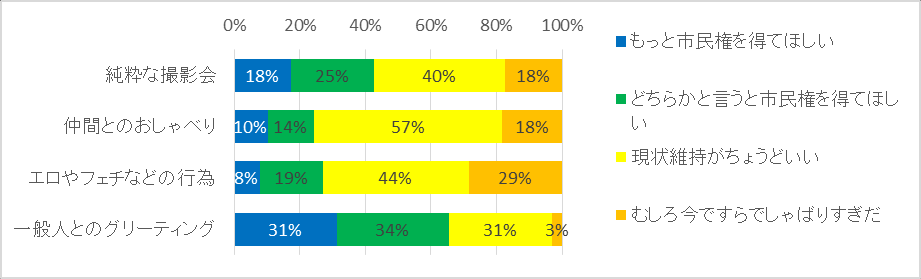 Figure 151: Social recognition of kigurumi preferences by length of activity
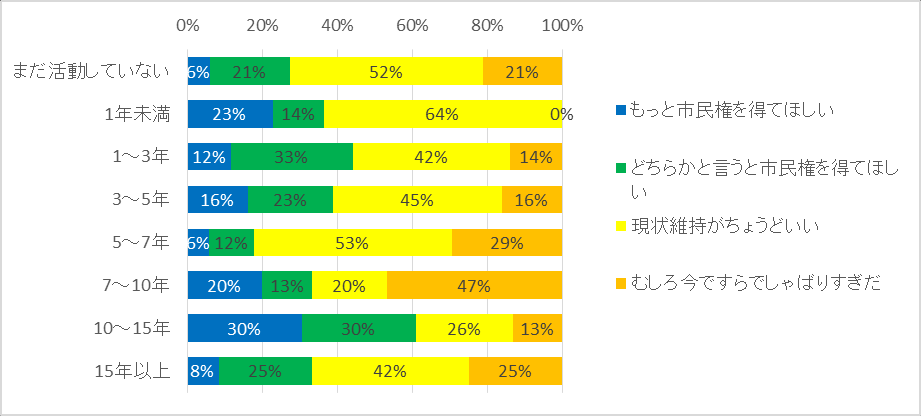
44. Is there sexual excitement about kigurumi?
Figure 152 shows the responses of 214 valid respondents to the question “Will there be sexual excitement towards kigurumi”. Sixty-nine percent of the answers are "created," 22 percent of the answers are "how much produced," and more than 90 percent of the answers are, to some extent, sexual excretion. 8 The answer of the valid female respondents was: “to produce” 25 per cent, “to produce more” 25 per cent, “not much” 13 per cent and “not produce” 38 per cent.
Figure 153 shows responses by kigurumi awakening period. The sooner they wake up, the stronger the sexual excitement towards Kigurumi. Eighty-eight per cent of those who woke up before primary school replied that “sexual excitation occurs”; and 50 per cent of those who woke up at the social stage chose “sexual excitation”.
Figure 154 shows responses by region. In Kansai and overseas, the answer to "sexual excretion" was lower, at 50 per cent. Local (East Japan) has the highest, 84% of the answer excavations "create."
Figure 155 shows whether a sense of pride in Kigurumi ' s hobby is relevant to the answer to that question, but no explicit reliance was found.
Figure 156 shows the answer to the question by the field of kigurumi charm. The response to “sexual excitation” was 85 per cent “acts of adults/loves, etc.”, 67 per cent “pure photo fairs”, 59 per cent “growing” and 55 per cent “talking with peers”.
Figure 157 shows the answer to that question by opportunity to know kigurumi. Of those who “see on the Internet” and know, 75 percent choose “to create sexual excitement”; and of those who “see in the show” “see in the show” “know friends who do”, only about 50 percent choose “to create sexual excitement”.
Figure 152: Answers to whether kigurumi is sexually excited
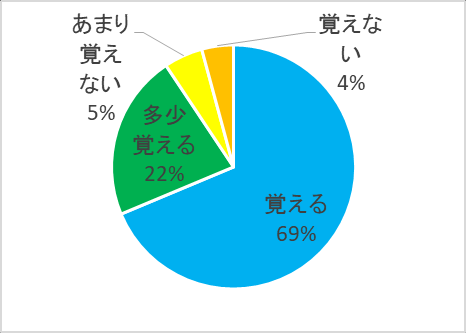 Figure 153: Sexually motivated responses by kigurumi awakening period
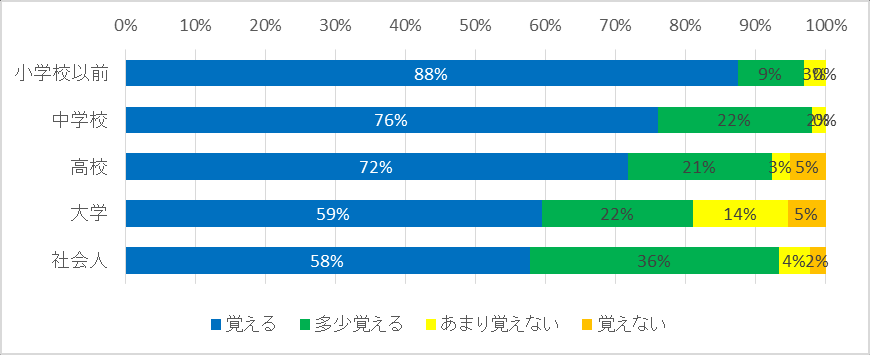 Figure 154: Sexually excited responses to kigurumi by region
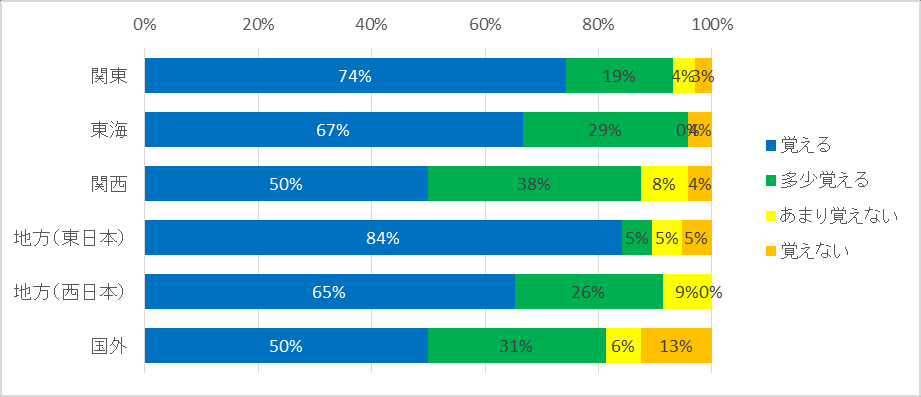 Figure 155: Proudness of kigurumi's hobby is related to whether or not to have sexual excitement.
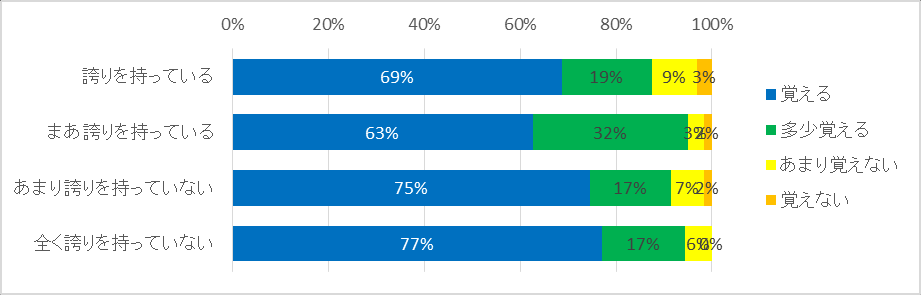 Figure 156: Sexually motivated responses by kigurumi charisma
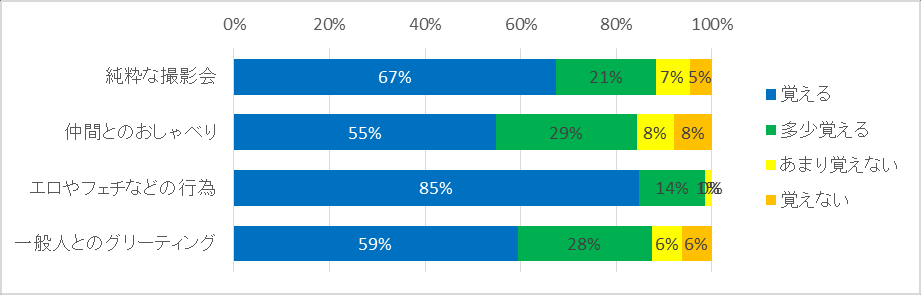 Figure 157: Sexual excretion responses by opportunity to know kigurumi
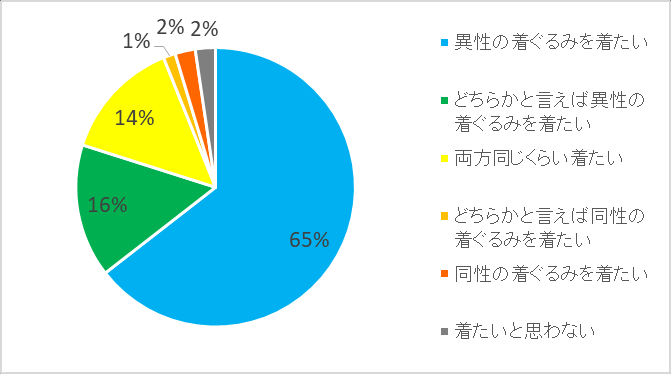
45. Kigurumi, same-sex and opposite-sex, which side to wear
Figure 158 shows the responses of 216 valid respondents to “Kigurumi of the same sex and Kigurumi of the opposite sex, which side to wear”. Sixty-five percent of the answers were “wanted to wear kigurumi”, and 16 percent were “wanted to wear kigurumi”, totaling 81 percent. On the other hand, “both want to wear” is 14%. The answer to the question is 3% of those who want to wear kigurumi of the same sex. In addition, 9 women replied: “wanted to wear the opposite sex (male) kigurumi” 0%, “wanted to wear the opposite sex (male) kigurumi” 11%, “wanted to wear both” 11%, “wanted to wear the same sex (female) kigurumi” 44%, “wanted to wear the same sex (female) kigurumi” 44%.
Figure 159 shows the responses broken down by kigurumi glamour. The answer to kigurumi, who wanted to wear the opposite sex, was most often to those who chose “acts like adult/love” and 79 per cent to kigurumi. Second, the choice of "greating" was 72%, "talking" 57% and "pure photography" 56%.
Figure 160 illustrates the relationship between the answer to whether kigurumi is sexually excited and the answer to that question. The more sexually excited people are at Kigurumi, the more they want to wear kigurumi. Seventy-three per cent of those who responded to Kigurumi's “causing” sexual excretion, 56 per cent of those who wanted to wear chigurumi; and 13 per cent of those who said “do not produce much”, and 38 per cent of those who wanted to wear chigurumi of the same sex.
Figure 158: Which side do you want kigurumi to wear?
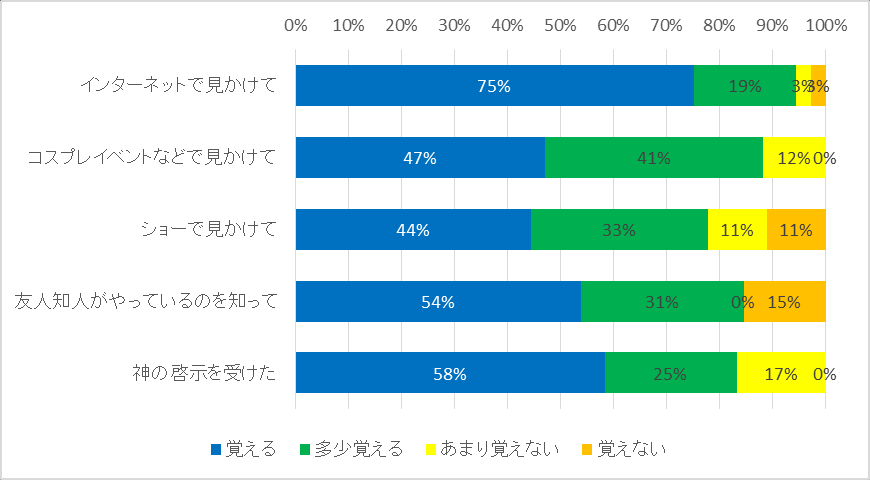 Figure 159: Which side of the glamourmi would like to be answered by homo/homosexual kigurumi?
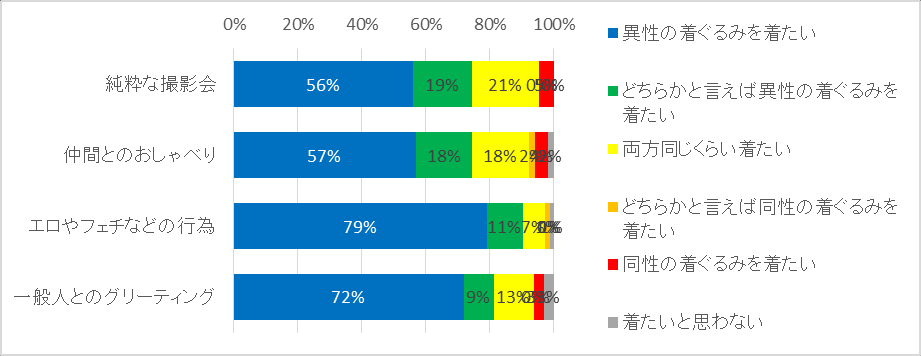 Figure 160: The degree of sexual excitement towards kigurumi is related to which side kigurumi wants to wear
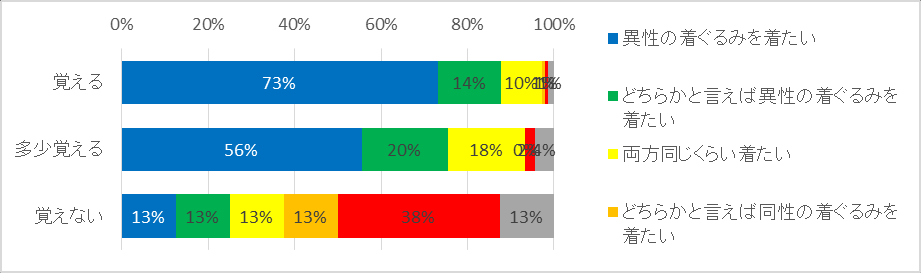
46. Gender across borders Sensor.
Figure 161 shows the responses of 212 effective respondents to “in the Kigurumi Circle, girls are often played by men. Do you think this gender crosses the border is attractive?” Answer. The term “considered attractive” is 65 per cent, while the term “more attractive” is 27 per cent and, in total, 92 per cent considers this gender to be attractive across borders. In addition, 7 women valid respondents responded with 43 per cent of the responses: “Advancement considered attractive”, 14 per cent of the responses were “More attractive”, 29 per cent of the responses were “Not very attractive”, and 14 per cent were “Not particularly attractive”.
Figure 162 shows the answer to that question by the degree of sexual excitation of kigurumi. The response to kigurumi's sexual excitation “would” was 78 per cent, while the response to kigurumi's sexual expediency was 35 per cent, to kigurumi was 61 per cent, and a more moderate response was the upper hand. On the other hand, in the “no-generation” layers of sexual excretion, 50 percent of the answers to gender cross-borderity are “considered attractive”.
Figure 163 shows the responses to that question by the kigurumi awakening period. The earlier they wake up, the more inclined they are to find gender attractive across borders. Of the “pre-primary” awakenings, 84 per cent chose “to think attractive”; of the “social” awakeners, only 51 per cent chose “to think attractive”.
Figure 164 shows the relationship between a sense of pride in Kigurumi's hobby and the answer to that question. The answer to the question of “proudness” is that gender cross-borderity is most attractive. Eighty-four per cent of those who answered the question “with pride” thought that gender cross-borderity was attractive; in addition, less than 70 per cent of those who thought it was attractive.
Figure 165 shows the relationship between the performance score and the answer to that question. The more people who know how to play high marks, the more they tend to think that gender is attractive across borders.
Figure 161: Charms of the cross-border gender of Kigurumi
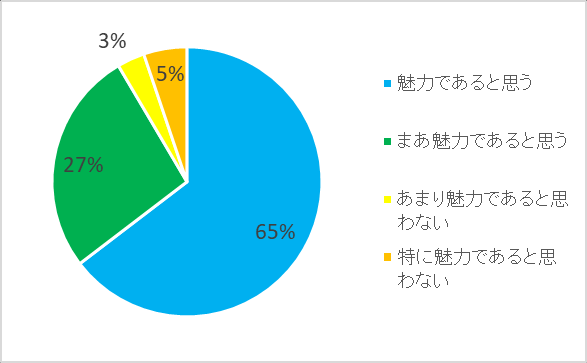 Figure 162: Gender cross-border charisma by level of sexual excitement towards kigurumi Sensor.
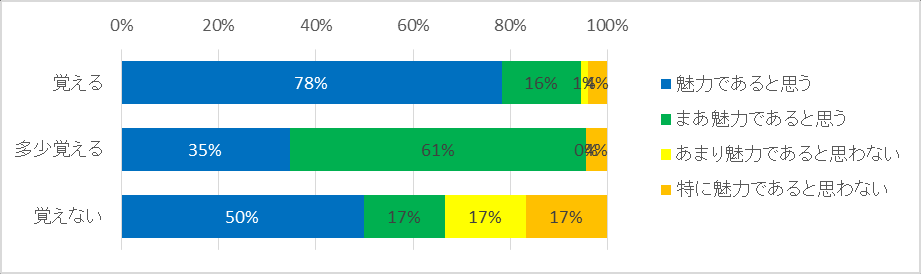 Figure 163: Gender Transboundary Charms by Kigurumi Awakening Period Sensor.
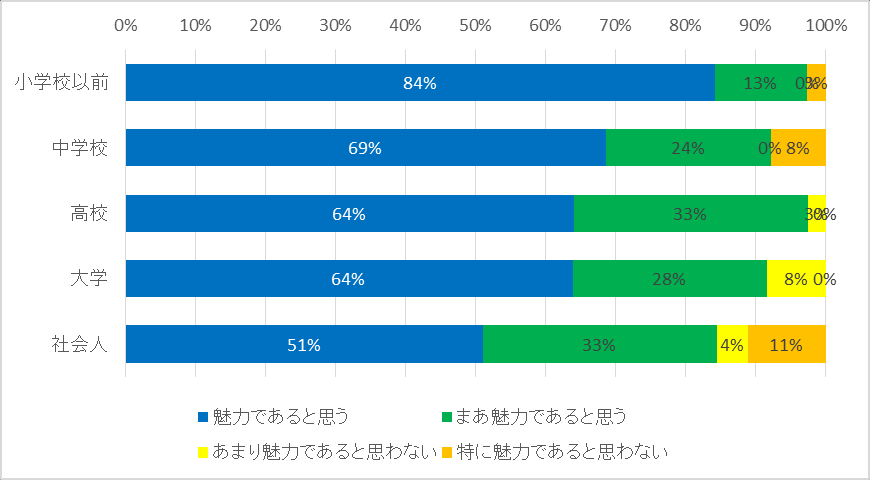 Figure 164: Transboundary charisma by pride in Kigurumi Sensor.
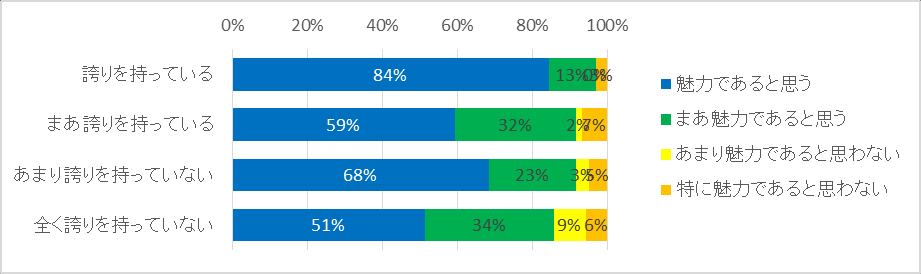 Figure 165: A self-playing self-rating relationship with kigurumi ' s hobby of cross-border charisma
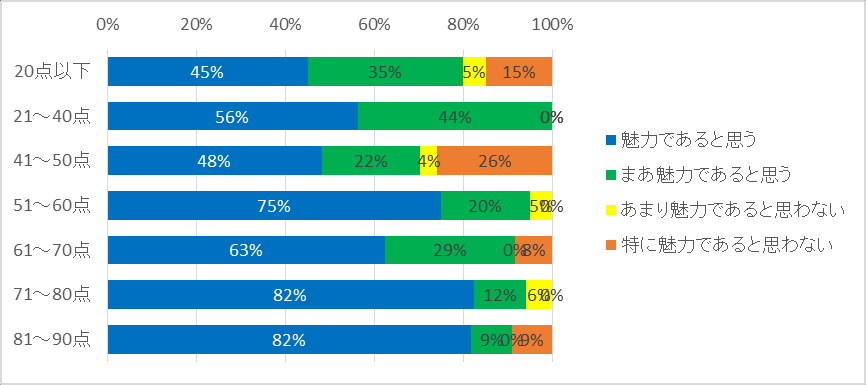
47. Questions on kigurumi technology
Figure 166 shows the responses of 213 valid respondents to the question “Do you think it is attractive if there is a kigurumi who can make a girl's voice”. Fifty-seven per cent of the answers were “considered attractive”, 26 per cent were “more attractive”, and 83 per cent of the total felt that it would be attractive to have such technology.
Figure 167 shows whether kigurumi is sexually excited in relation to the answer to that question. Sixty-three per cent of the respondents to kigurumi's sexual excretion “generation” were attractive to the girl; and less than 50 per cent of the respondents to kigurumi's sexual excavation “does not produce much” in the “do not produce” layer. The greater the sexual excitement towards Kigurumi, the more the tendency is to think that it makes a girl's voice attractive.
Figure 168 shows the response of 183 valid respondents to “Do you think it's attractive if there is a kigurumi who can change his face according to his will”. Fifty-seven per cent of the answers were “considered attractive”, 32 per cent of the answers were “more attractive”, and 89 per cent of the total were of the opinion that it would be attractive to have such a technology.
Similarly, figure 169 shows the answer by whether kigurumi is sexually excited. Sixty-one percent of the people who were sexually excited about kigurumi “created” replied, “thinks it attractive”. Forty-five percent of the people who were sexually excited about kigurumi were "how much would it produce" and said, "I think it's attractive." However, among those who “do not produce” kigurumi sexual excitement, 86 per cent responded that the technology “thinks attractive”.
Figure 166: If there's a chigurumi that can make a girl's voice, is there a charm?
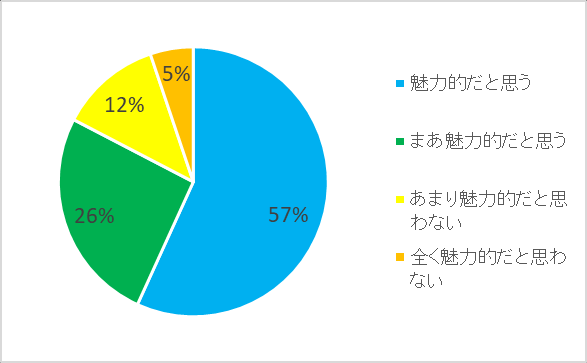 Figure 167: Charms of Kigurumi who can make a girl's voice, by sex-excitedness Sensor.
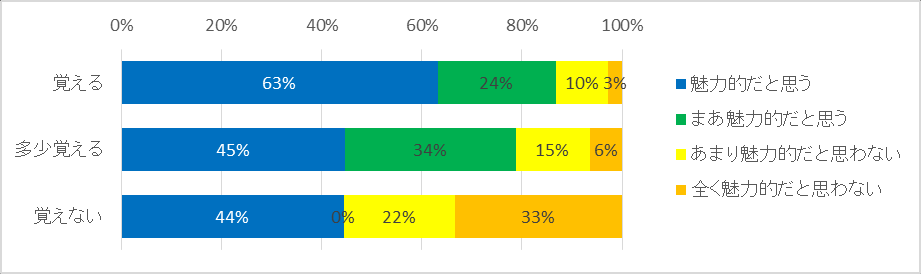 Figure 168: Charms if there is a kigurumi that can change the face
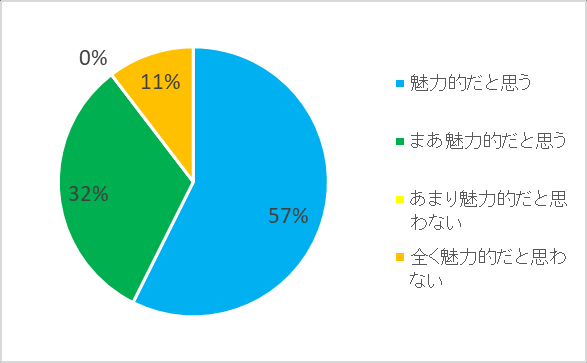 Figure 169: The glamour of kigurumi by whether or not it produces sexual excitement Sensor.
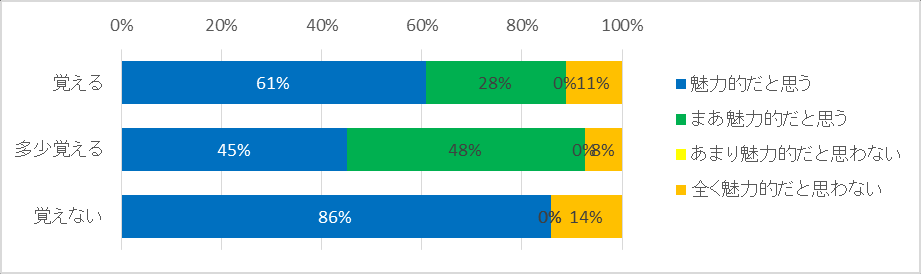
48. Perceptions of intimacy with men in kigurumi
Figure 170 shows the views of 133 people who were effective respondents to the inside performer event on “intimacy with men in their kigurumi”. The option can be chosen from the "unwanted intimacy" "a degree of embrace" "a degree of kiss can" "a degree of orgasm, such as with an electric massager or hand conduct", to the "a degree of orgasm, such as by hand conduct", to the "insertion or" six stages. The selection of the strongest "inserted or otherwise" is 23%. The second one, “the degree of climaxation by hand, etc.”, is 28%. “The degree of orgasm can be brought to 21%, “the degree of kissing” to 3% and “the degree of hugging” to 17%. “Don't want intimacy”, which is 8 per cent, confirms the wide distribution of views.
Figure 171 shows the responses by sexual orientation. Bisexuals and others show a similar tendency, with more than 60 per cent opting for “the degree of orgasm by hand, etc.” and more than 30 per cent being “plugged or”. On the other hand, heterosexuals are slightly negative of intimate contact with men, with 15 percent replying, "Don't want intimacy," and 27 percent reply, "Acceptance." On the other hand, however, there are 12% of the options that you can insert.
Figure 172 illustrates the relationship between the glamourity of the kigurumi hobby and the question. The more attractive people consider gender to be transboundary, the more positive they are about intimate contact with men.
Figure 173 shows the responses by region. Intimate contact with men is viewed more positively in known places than in urban circles. Of the three major urban circles, the Tokai and Kansai are more passive than Kanto. In addition, 30 per cent of the overseas population is “not interested in intimacy”.
Figure 174 shows responses by age. The younger the person, the more positive the relationship with men is. Forty-four per cent of those under 25 years of age consider that “it is possible to be inserted”; while only 10 per cent of those over 40 consider that “it is possible to be inserted”.
Figure 170: Perceptions of intimate behaviour with men in kigurumi
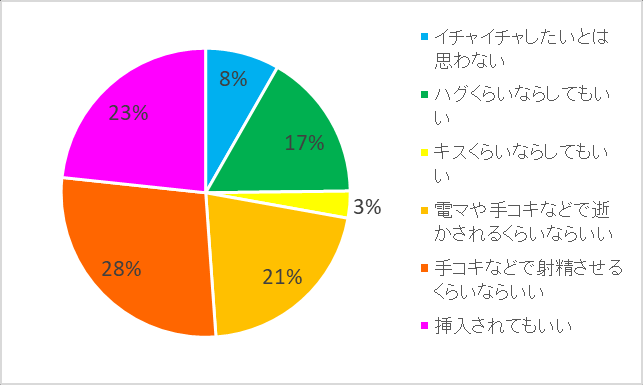 Figure 171: Perceptions of intimate behaviour with men in their kigurumi by sexual orientation
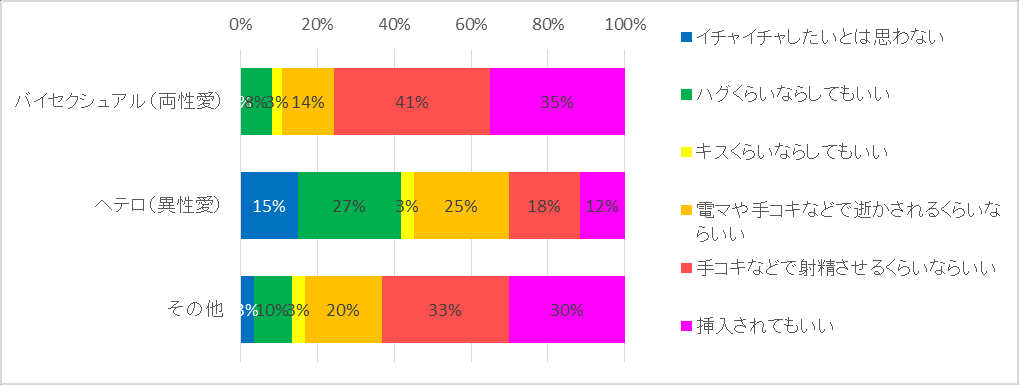 Figure 172: Kigurumi ' s attachment to cross-border charisma and the perception of his intimacy with men
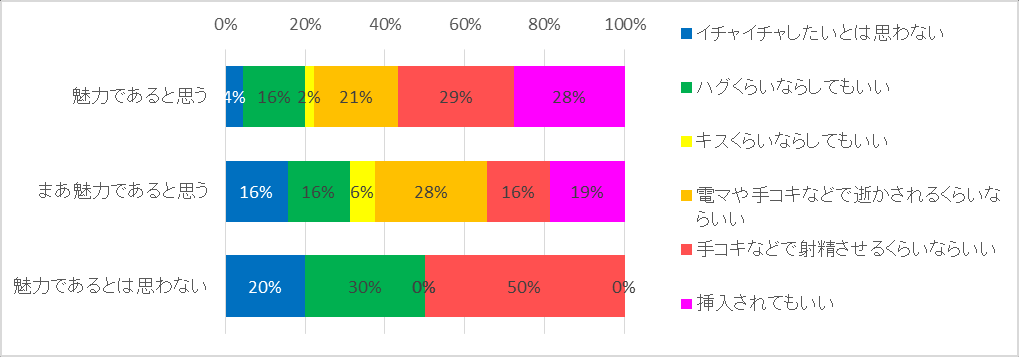 Figure 173: Perceptions of kigurumi ' s intimate behaviour with men, by region
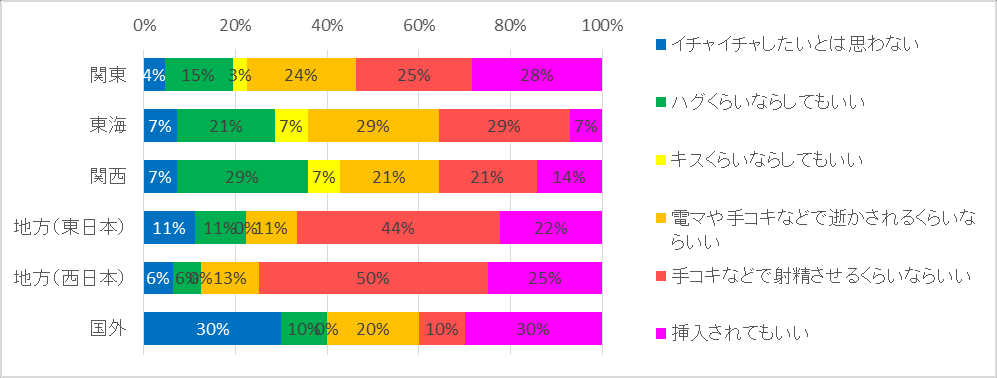 Figure 174: Age-specific perceptions of intimate behaviour with men in kigurumi
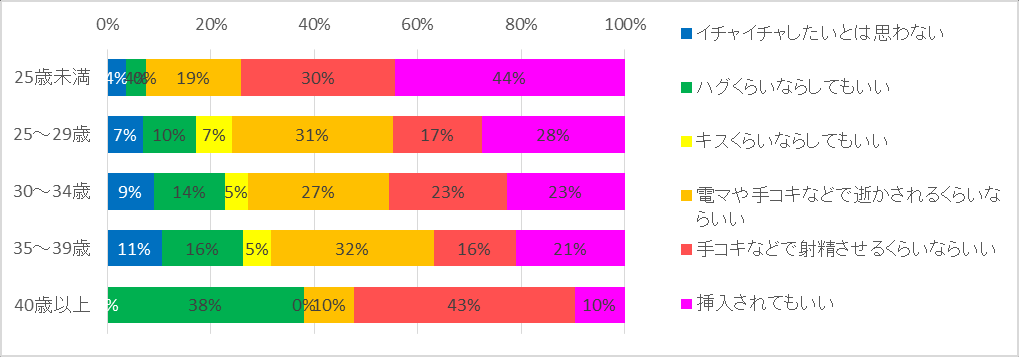
49. Experience and intent of kissing Kigurumi
Figure 175 shows the responses of 174 effective respondents to “Whether or not they want to kiss Kigurumi and whether they often kiss”. Twenty-five percent answered "no kissing," 32 percent answered "no kissing," 33 percent answered "kissing," 10 percent answered "often kissing."
Figure 176 shows the answer to that question by whether Kigurumi is proud. The less he likes to be proud, the more he says, “I don't want to kiss him”. However, the answers to the “proudness” level have increased and become polarized: “Don't want to kiss kigurumi” and “often kiss kigurumi”.
Figure 175: Experience and intentions in kissing Kigurumi
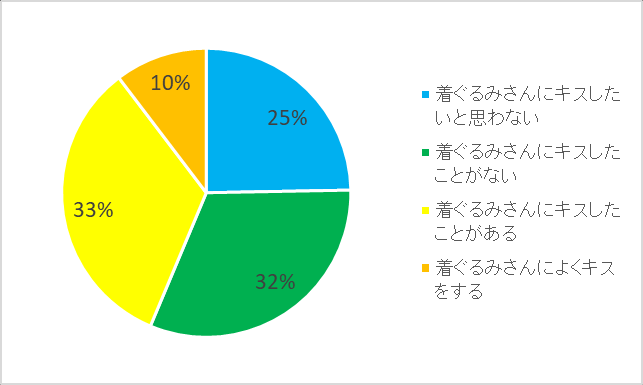 Figure 176: Kissing experience and intentions by degree of pride in Kigurumi
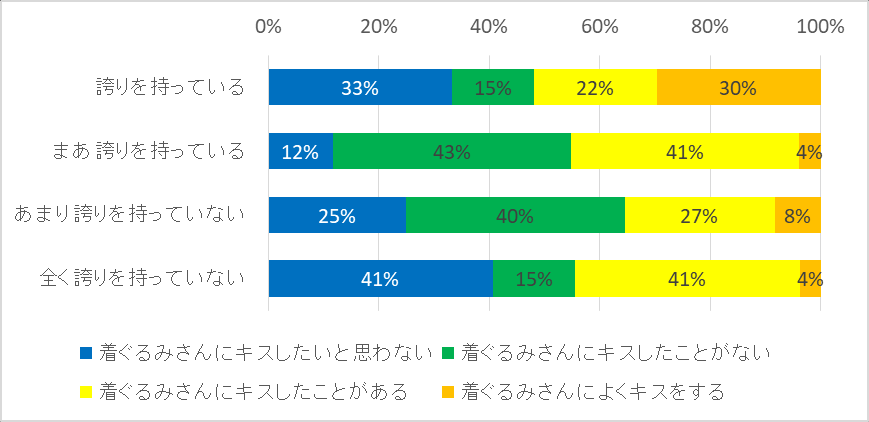
50. Hand-held sexual experience
Figure 177 shows the responses of 136 persons who were effective respondents to the inside performer event on “the experience of hand sex for men after becoming kigurumi and the experience of ikigurumi in hand sex”. The number of “acts done but not done” was 9 per cent, “dos done but not done” 11 per cent, “dos done” 49 per cent, “dos done neither done nor done” 27 per cent, “dos not want to do or wants to be done” 4 per cent.
Table 13 shows the rate of “doing” by sexual orientation. Bisexuals are about 70%, others about 65%, even heterosexuals about 50% answer with experience. Whether there are significant differences is subtle, but among bisexuals and others, there are more “exposed” than “exposed”; among heterosexuals, there are more “exposed” than “exposed”.
| Sexual orientation | Yes. | He did. |
|---|---|---|
| Bisexual | 74 | 66 |
| Hetero. | 45 | 49 |
| Other | 68 | 62 |
Table 13: Rate of experience with hand-held sex by sexual orientation
Figure 177: Experience with hand sex for men and hand sex for kigurumi by inside performer activists
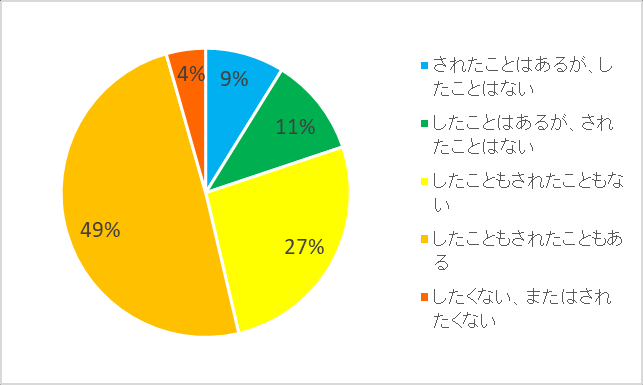
51. Alien and kigurumi, which one is excited?
Figure 178 shows the responses of 220 effective respondents to "Violent heterosexuality and kigurumi, which is more exciting". “Biosexuality” is 21 per cent, “Ber-Ber-Ber-Ber-Ber-Ber-Ber-Ber-Ber-Ber-Ber-Ber-Ber-Ber-Ber-Ber-Ber-Ber-Ber-Ber-Ber-Ber-Ber-Ber-Ber-Ber-Ber-Ber-Ber-Ber-Ber-Ber-Ber-Ber-Ber-Ber-Ber-Ber-Ber-Ber-Ber-Ber-Ber-Ber-Ber-Ber-Ber-Ber-Ber-Ber-Ber-Ber-Ber-Ber-Ber-B-B-B,” and “B-B-B-B-B” is 13 per cent. More people are more excited about kigurumi than he is.
Figure 179 shows the responses to that question, broken down by kigurumi awakening period. More than half of those who woke up during the university were more excited about the opposite sex; apart from that, however, the answer did not depend particularly on the period of awakening, and more people chose to be more excited about Kigurumi.
Figure 180 shows answers by sexual orientation. Among heterosexuals, 48 per cent are “living heterosexuals” and 49 per cent are “kigurumi” who counterbalance each other. Among bisexuals, 30 per cent are “breeding opposite sex”, 60 per cent are “kigurumi”, and more are excited about Kigurumi. Among the others, only 16 per cent were excited about “living heterosexuals”, and 81 per cent, the majority, were excited about “kigurumi”.
Figure 178: Heterosexuals and Kigurumi are more excited.
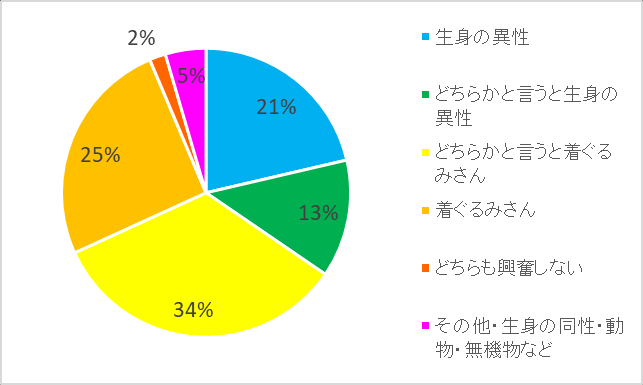 Figure 179: Heterosexuality and kigurumi excitement by kigurumi awakening period
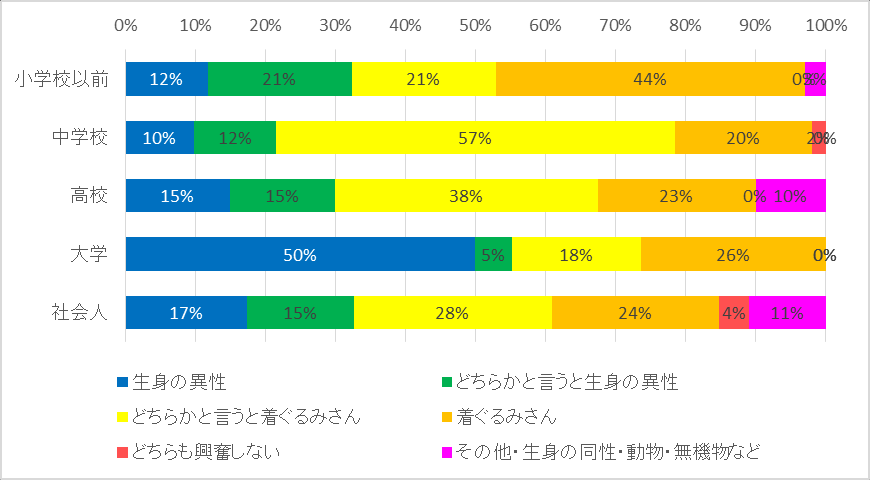 Figure 180: Heterosexuality by sexual orientation and kigurumi excites
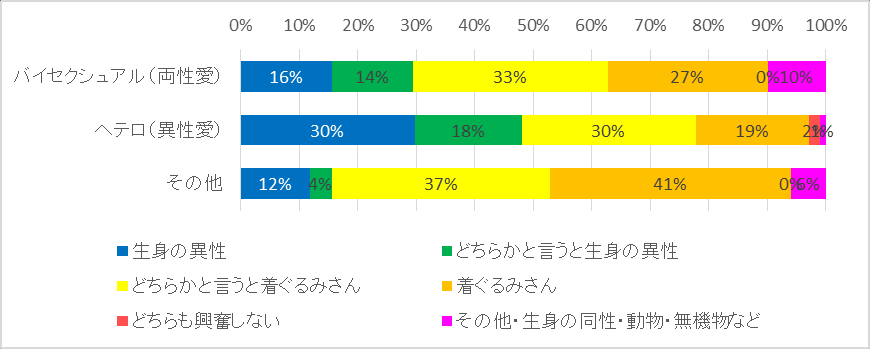
Is it cute being inside performer?
Figure 181 shows the responses of 204 or 205 effective respondents to the question “Does the age group (male/female) feel attractive when working as inside performer (boy/girl)” In the case of the girl kigurumi, there is no significant difference between men and women. The age difference is even greater than the sex; 40 years of age and 20 years of age are about 20% less than the "pretty" answer, and the younger inside performer, the more attractive. In the case of the boy kigurumi, it was considered that inside performer was a better answer for women.
The answer below, which excludes “not known”, is given as 4 points, 3 points, 2 points, 1 points, and an average comparison. The average share is shown in table 14. The highest average score, which is considered to be the youngest case of inside performer, is “Kigurumiinside performer for girls in their 20s”, which is 3.53. The second is “Kigurumiinside performer, a girl in his 20s”, with a point of 3.50. On the other hand, the lowest is the “kigurumiinside performer, a boy in his 40s”, which is 2.19 points.
Figure 182 shows the average score of respondents by sexual orientation. Regardless of the sex and age of Kigurumi and inside performer, bisexuals in all cases give higher marks than heterosexuals and others. In girls kigurumi, bisexuals give a higher average for males than females inside performer; heterosexuals give a higher average for females inside performer than males. However, at the time of the boy kigurumi, women inside performer were given higher average points than men inside performer, both bisexual and heterosexual.
Figure 183 shows the average score by whether kigurumi ' s gender is attractive across borders. When inside performer is male, the higher the average, regardless of the kigurumi sex, the more attractive the kigurumi gender is. On the other hand, when inside performer is a woman, although the difference is very small, it is not considered that the glamour of gender across borders tends to give a higher average.
Figure 184 shows the average score by age of the respondent. The lower the age of the respondents, the higher the average, in the case of “20-year-old men as girls” and “20-year-old women as boys”. On the other hand, the higher the age of the respondents, the higher the average, the higher the “40-year-old male-girl”, “40-year-old female-girl”, and “40-year-old female-girl-boy-boy”.
Figure 185 shows whether inside performer's average score by kigurumi charisma field is the prettiest. Watching the characteristics of the four glamour fields, choosing the “challenge with peers” layer is the most sensitive to inside performer age, which tends to give low averages in the 40s. In choosing the “adult/love” class, when the inside performer and kigurumi sexes are men, negative answers are more often given regardless of age and average scores are difficult to rise.
| Situation | Average score |
|---|---|
| 20-year-old male as a girl | 3.50 |
| 20-year-old females as girls | 3.53 |
| 40-year-old male as girl | 2.77 |
| 40-year-old women as girls | 2.80 |
| 20-year-old male boy | 2.68 |
| 20-year-old female boy kigurumi | 3.18 |
| 40-year-old male boy kigurumi | 2.19 |
| 40-year-old female boy kigurumi | 2.61 |
Table 14: Premature score as inside performer
Figure 181: Is it cute as inside performer?
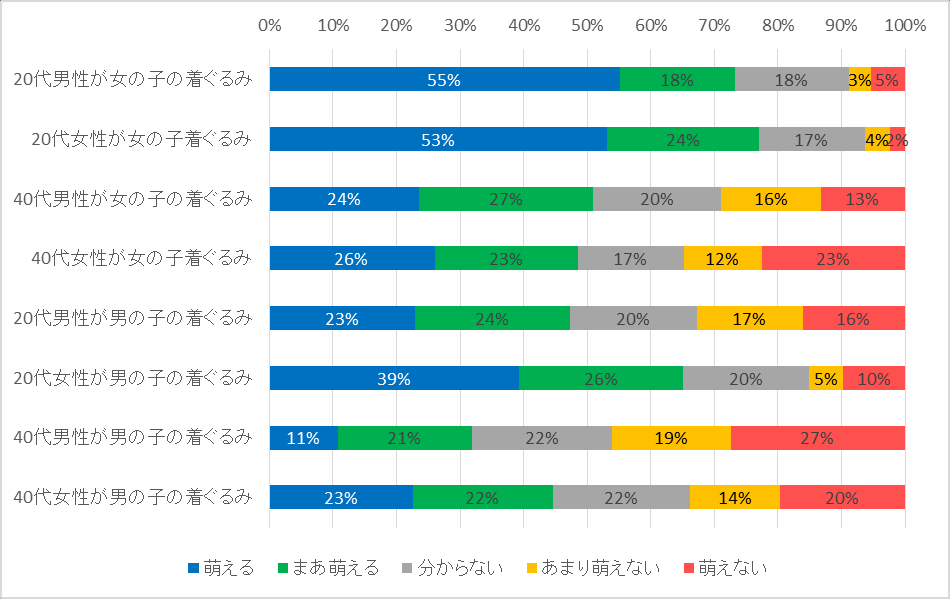 Figure 182: Average inside performer by sexual orientation
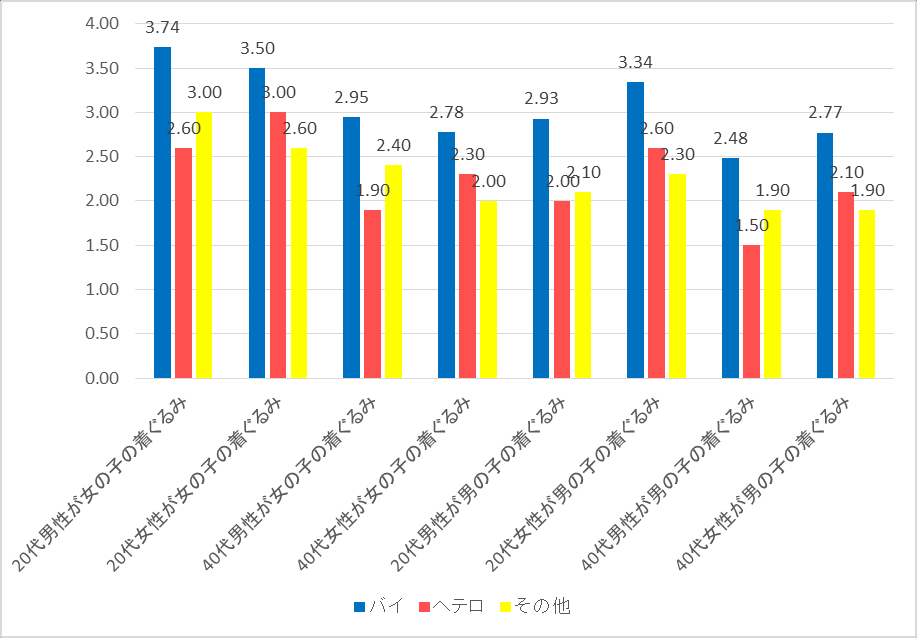 Figure 183: Gender cross-border charisma and whether or not it's an average as inside performer
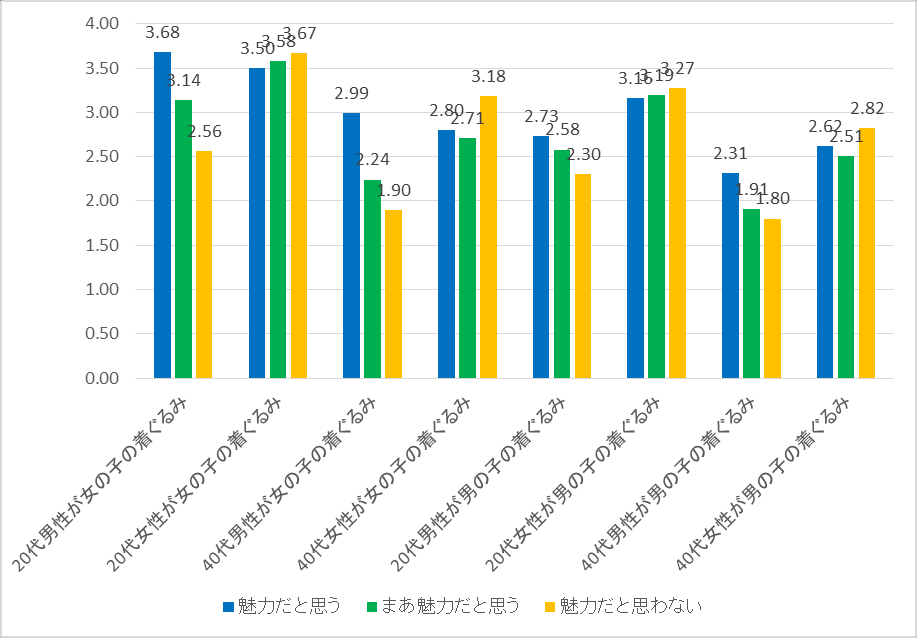 Figure 184: Average inside performer by age
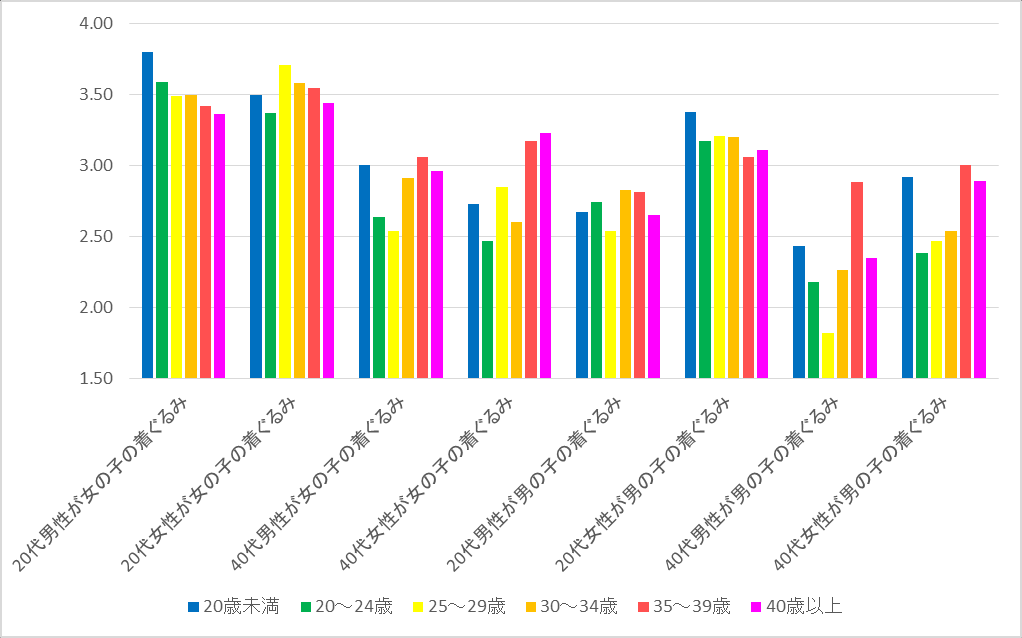 Figure 185: Average inside performer by kigurumi charisma
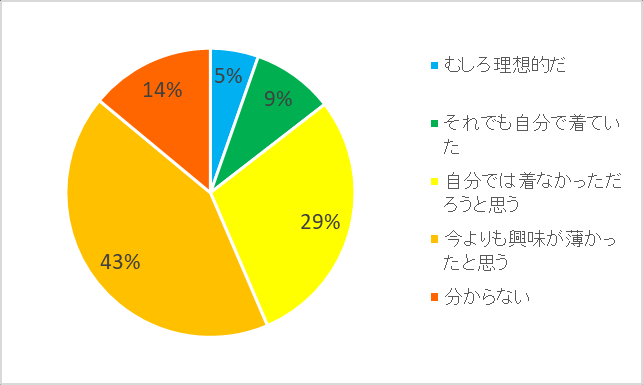
53. If there is no Hada-tai
Figure 186 shows the views of 186 valid respondents, including “not known”, on “if there is no Hada-tai”. And 43 percent of the answer was "interest will be lighter than it is today," 29 percent said "likely I won't wear it," 9 percent said "even if I wear it," and 5 percent said "better."
In a cross-section with the view of the sous-pants, among those who answer “now actually do so”, “in fact, it would be better to wear” 0 per cent, “even so they would wear” 18 per cent, “they would probably not wear” 32 per cent and “interest would be less” 41 per cent. The answer to the question “if conditions permit, it would have been preferable to do so” was 9 per cent, 23 per cent, 23 per cent, 23 per cent and 41 per cent.
In addition, seven of the women who responded effectively said: “It would be better to wear” 0%, “I would wear” 11%, “I wouldn't wear” 22%, “interest would be less” 56%.
Figure 186: Without Hada-tai
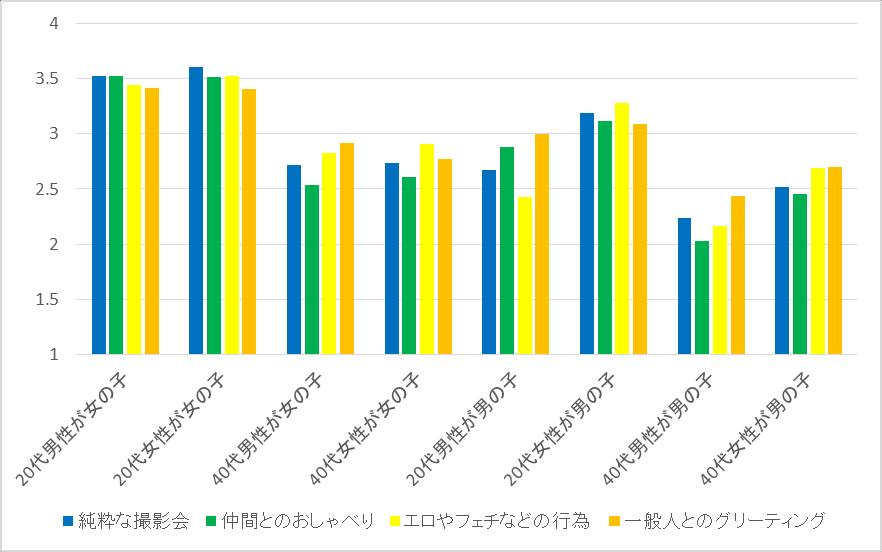
54. Reading status of inside doll
Figure 187 shows the reading status of 218 valid respondents for inside doll. "Recurring reading" is 17%, "frequent reading" is 24%, "neither read" is 16%, "not read at all" is 11% and "not known" is 32%. Also, inside doll is a Kigurumi novel by a pretty little girl, who often features men as inside performer in a special structure, Kigurumi. The kigurumi has a very strong philosophie structure: (1) the crotch has a breathing hole, so the inside performer can only breathe from inside his underwear, such as a skirt, which makes it very difficult to breathe; (2) the physical irritation to the inside performer is almost continuous, so that the inside performer must act as a girl in a state of continuous sexual pleasure.
Figure 188 shows the responses by year of activity. The longer the activity is known, the higher the rate of habitual reading inside doll. In addition, the number of people who do not know the inside doll is more than 63 per cent of those with shorter years of activity.
Figure 189 shows responses by awakening period. The sooner you wake up, the more you read inside doll. Seventy-two per cent of those who awaked before primary school used to read, while only 26 per cent of those who awaked at the social stage did so, and 46 per cent replied, "Don't know inside doll."
Figure 190 shows the answer to that question by whether or not kigurumi is sexually excited. 52% of the people who answer "creative" sexual excitement are used to reading; 24% of the people who answer "how much to produce" are used to reading. 67% of those who answer "no" sexual excitement don't know inside doll.
Figure 191 shows the responses by the opportunity to know kigurumi. People who are inspired are most accustomed to reading at 67 per cent, followed by people who are known to see on the Internet by 44 per cent. 41% of those who knew "see in cosplay" did not know inside doll; 85% of those who started "know friends who do" did not know inside doll.
Figure 187: Inside doll reading status
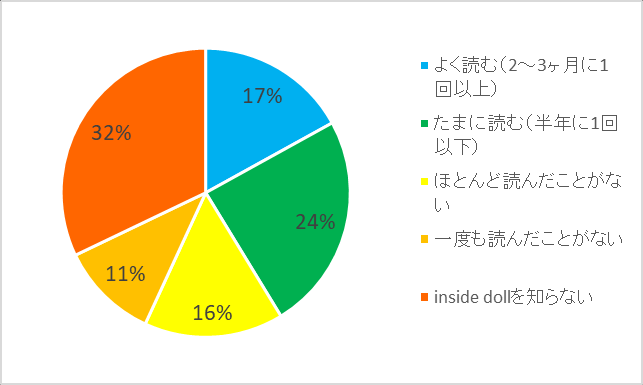 Figure 188: Inside doll reading status by year of activity
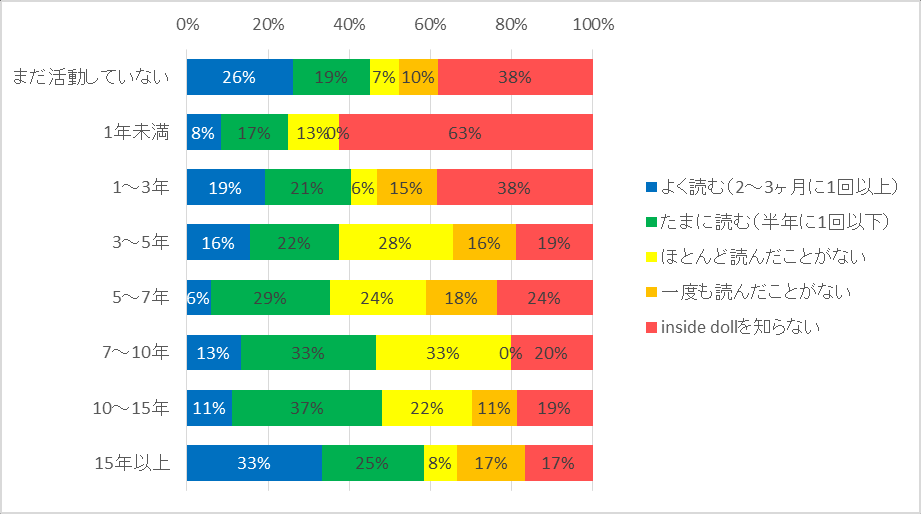 Figure 189: Inside doll reading status by awakening period
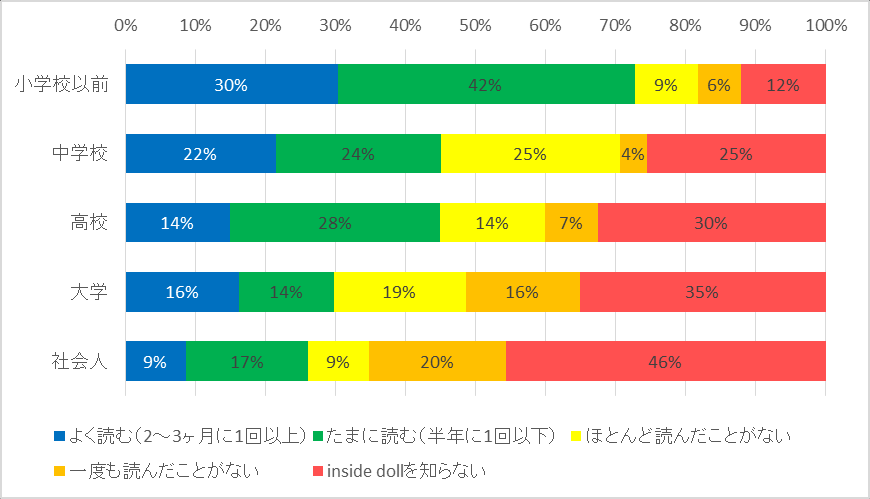 Figure 190: Inside doll reading status by sexual excitement about kigurumi
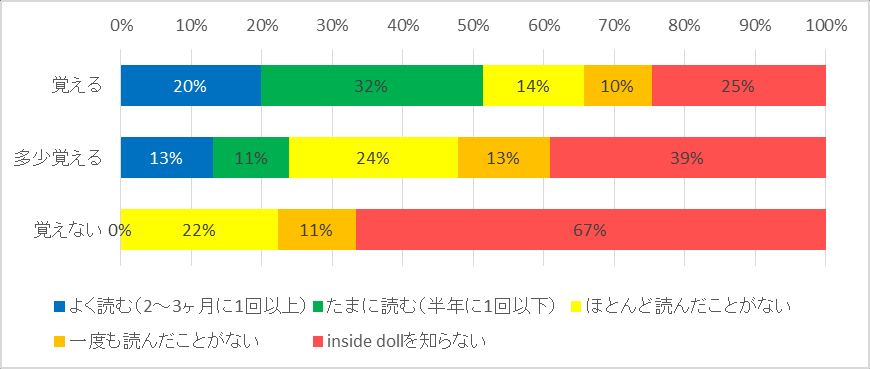 Figure 191: Inside doll reading according to a kigurumi hobby
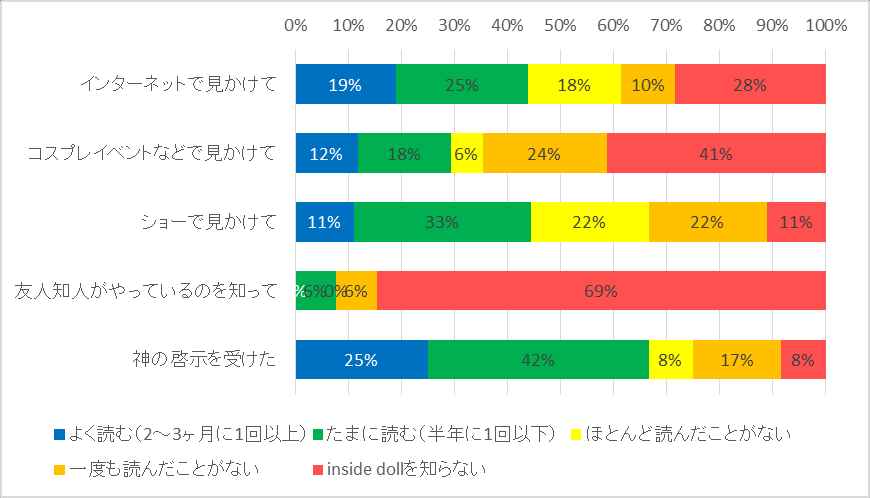
55. Peasant material
Figure 192 shows the frequency of use by respondents by masturbation material. Photos of others are used as the most frequent material, 50 per cent at least once a week. Only 15% of the people who never used it once.
Here, if at least once a month is defined as the customary use of material, the customary use of the material is as high as low: “seeing others in photographs”, 70 per cent; “diverse adult figure”, 45 per cent; “self in photographs”, 45 per cent; “kigurumi novel or figure”, 44 per cent; “self in mirrors, etc.”, 44 per cent; “three dollars ÁV”, 42 per cent; “kigurumi fantasy”, 40 per cent; “special ÁV”, 37 per cent; “inorganic/animal/homosexual/fanta” 26 per cent; “Kigurumi” 25 per cent; “Veterinary figure”, 17 per cent; “Let others wear and watch” 9 per cent. Table 15 summarizes the average masturbation frequency (second/person/month) of respondents by material.
Figure 193 shows the average frequency of masturbation by whether or not kigurumi is sexually excited. With regard to the material on kigurumi, the answer to the person who “creates” kigurumi sexual excitement is twice as frequent as the answer to “how much produces”. On the other hand, the answer to "do not produce" is that the three-dollar AV is used as a material twice as often as the answer to kigurumi's sexual excitement. The “Secondial Adult Chart” uses almost the same frequency across layers.
Figure 194 shows the average frequency of masturbation of materials by age. The strong age is shown to be dependent on “kigurumi photos of others” and “kigurumi novels or diagrams”: those under 20 years of age use these materials twice as often as those over 40. Other materials are hardly age-dependent.
Figure 195 shows the average frequency of masturbation by whether Kigurumi is proud. The more proud people who love kigurumi, the more frequently they use the words “in their mirrors and so on” as a material, “in their photographs and so forth”. In the area of masturbation, in particular, “proud people” use about three times as often as “no pride at all”. However, the frequency of masturbation “seeing other people's kigurumi photos” has not changed at all levels.
Figure 196 shows the average frequency of masturbation of the various materials by marriage. On the other hand, there is a higher frequency of masturbation on the floor of “not wanting to get married”, “who wears a mirror and so on”, “who wears a photograph”, “who wears a photograph”. The high frequency of masturbation in the “Ten Dollars AV” layer, “even if you leave the hobby strongly wants to get married”.
Figure 197 shows the average frequency of masturbation by kigurumi area of response. Among those who masturbate themselves, it is most often used as material by those who think it is the most attractive to be “greating” with ordinary people. On the contrary, the “Three Dollars AV” “Special AV” masturbation is less common, and these materials are often considered to be used by the most attractive “talking with peers” “acts of adults/loves, etc.”. Among those who used the “Three Dollars AV” masturbation, more chose “talking with peers” “acts such as adult/love” and among those who used “special AV” masturbation more chose “acts such as adult/love”.
| Materials | Frequency of masturbation (second/person/month) |
|---|---|
| I'm wearing a mirror. | 2.1 |
| Let others wear and watch (owner) | 0.4 |
| Photos of yourself and so on. | 2.4 |
| He was wearing pictures. | 4.5 |
| Kigurumi novels or graphics | 2.3 |
| Kigurumi Fantasies | 2.3 |
| Diagram of Adults | 2.8 |
| Orcs. | 0.8 |
| Three dollars AV | 2.3 |
| Special AV | 2.1 |
| Kigurumi, outside the Department of Girls | 1.4 |
| Inorganic/animal/same | 1.5 |
Table 15: Average frequency of masturbation by material for respondents
Figure 192: Frequency of masturbation material
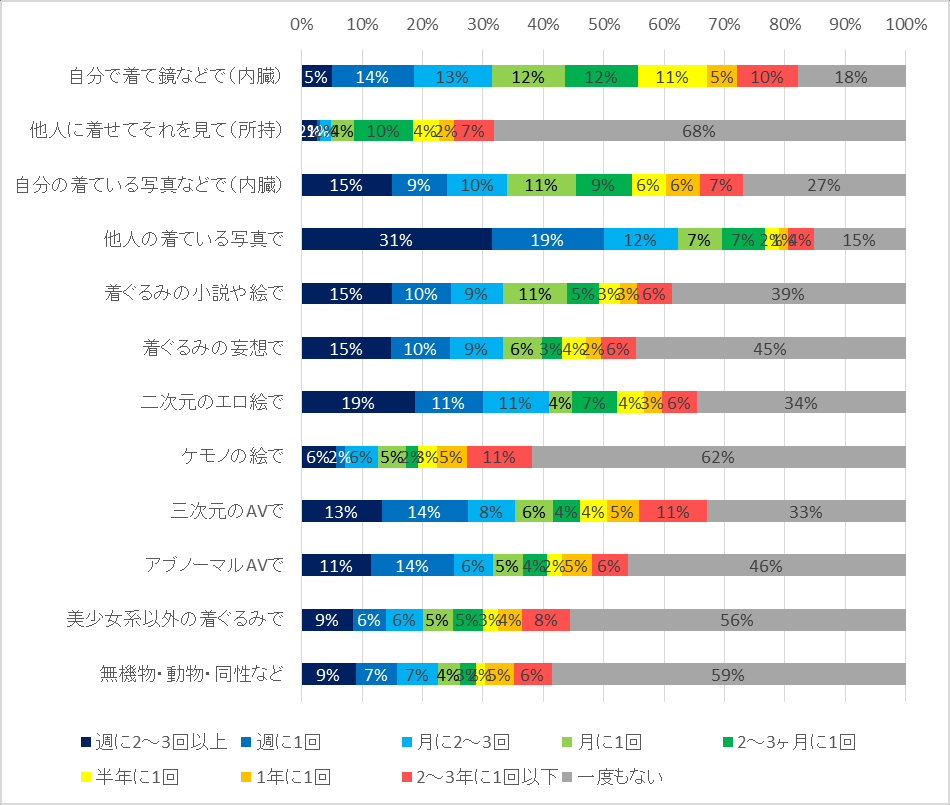 Figure 193: Average frequency of masturbation by whether or not kigurumi is sexually excited
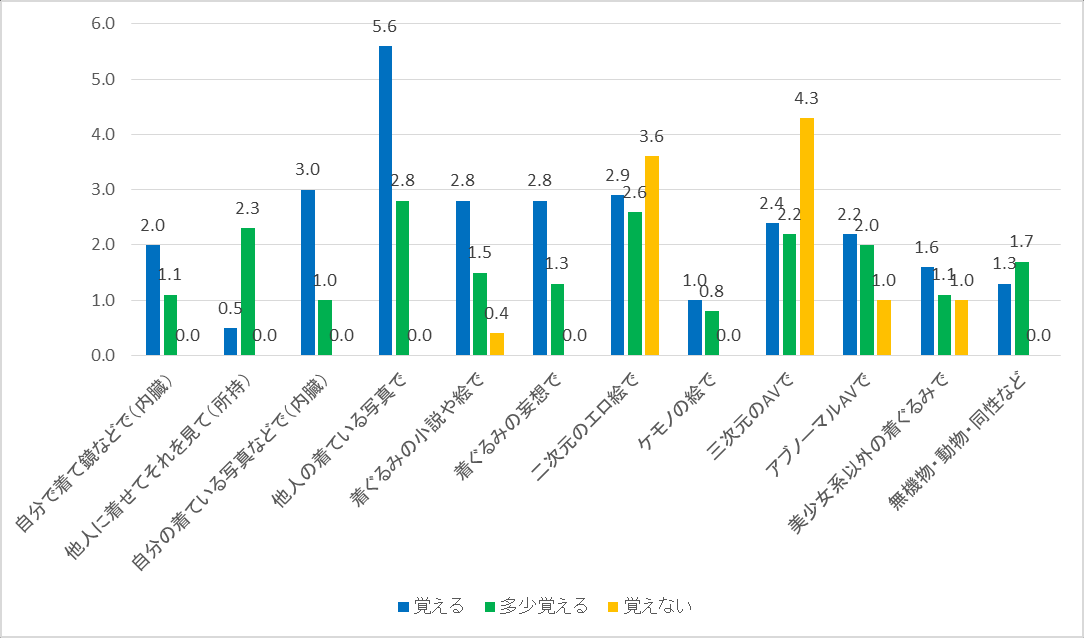 Figure 194: Average frequency of masturbation by age
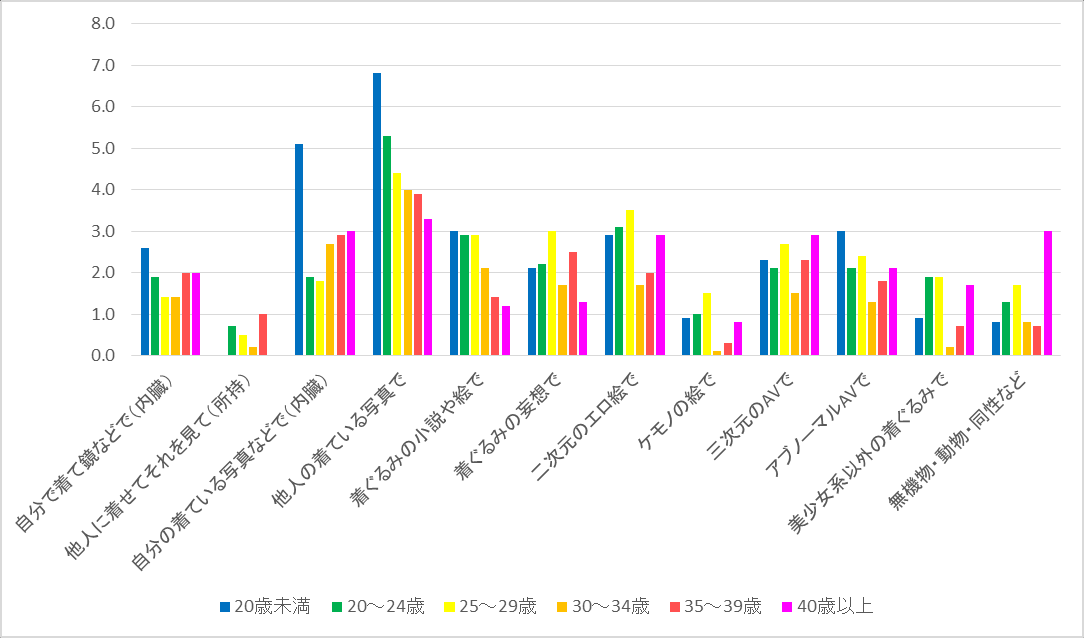 Figure 195: Average frequency of masturbation by pride in kigurumi
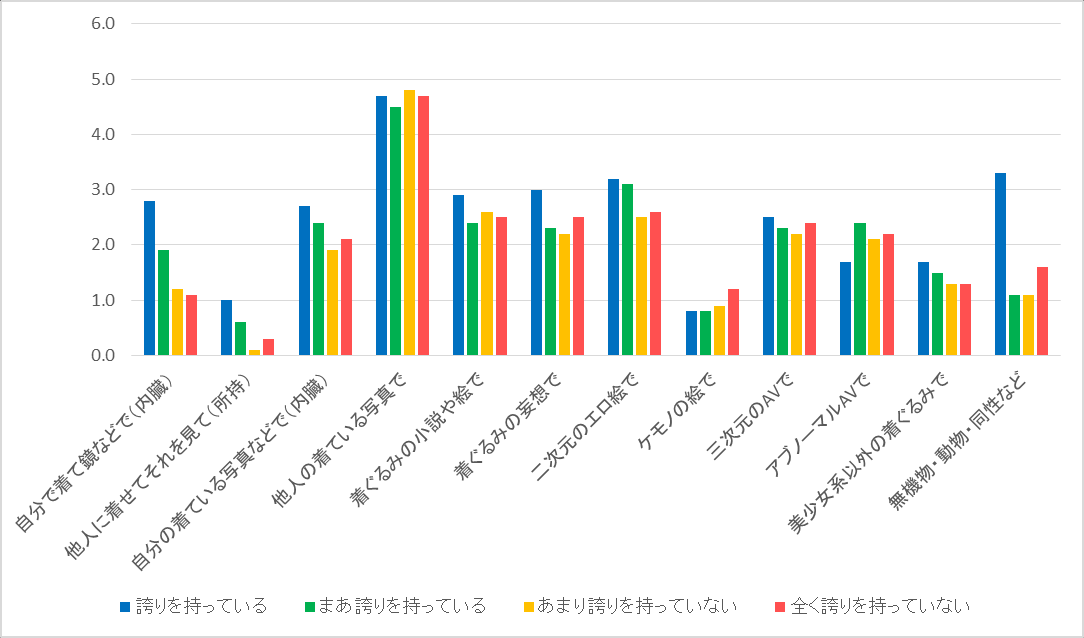 Figure 196: Average frequency of masturbation by marriage
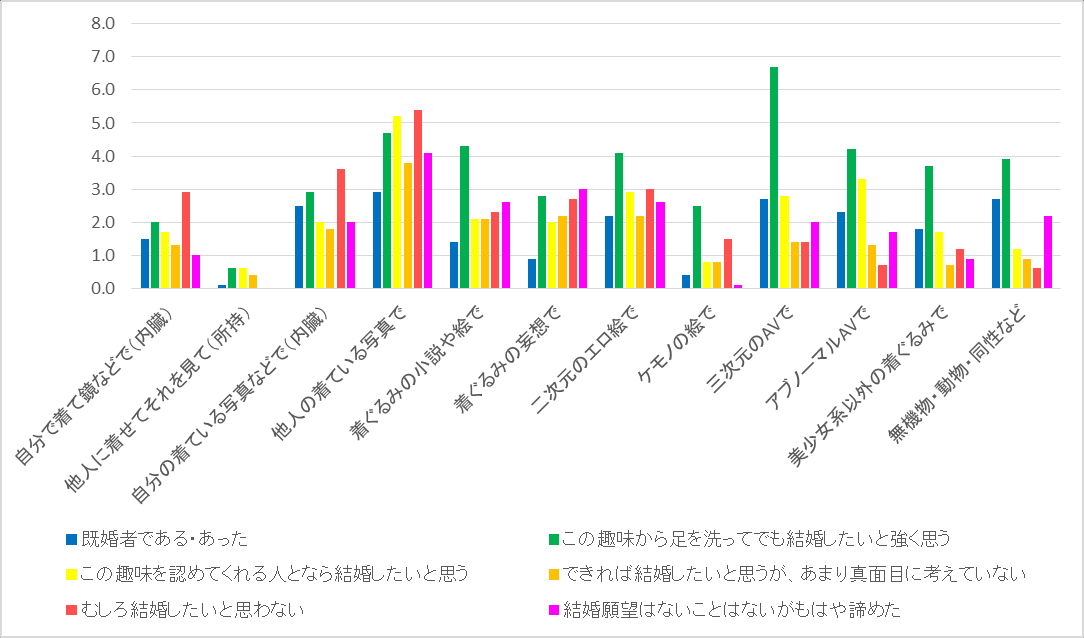 Figure 197: Average frequency of masturbation by kigurumi charisma
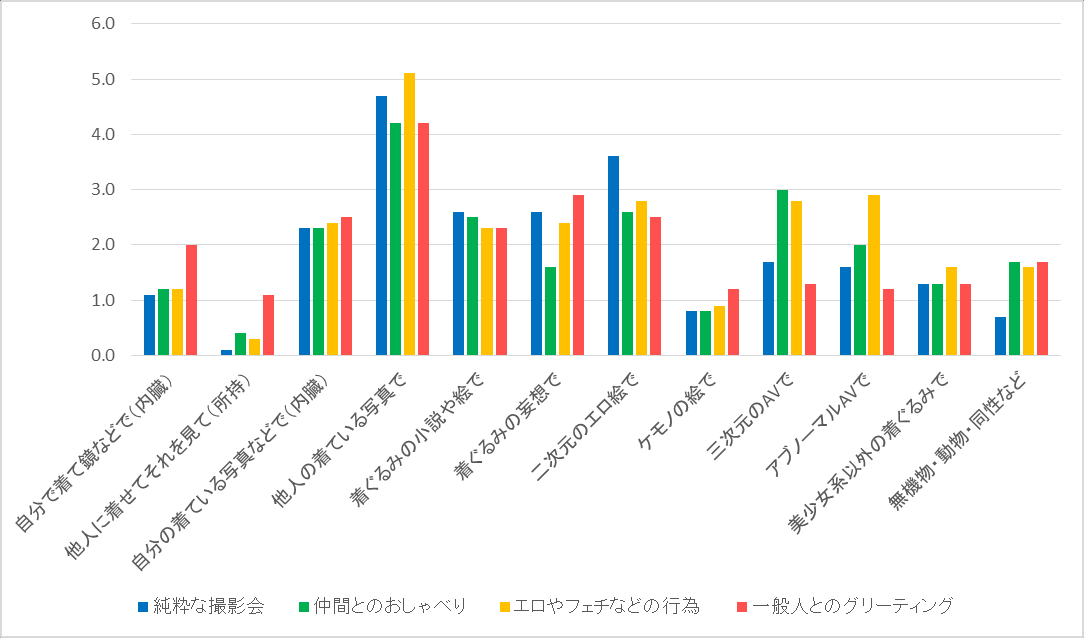
56. Possession of electric massage media
Figure 198 shows the availability of electric massage media for 177 active respondents. 63% answered "Yes," 37% answered "No."
Figure 199 shows the status of the ownership of electric massage parlours by whether or not kigurumi is sexually excited. Stimulation "creates" layers, 72% owns; "how much produces" layers, 50% owns; "does not produce" layers, 25% owns.
In addition, according to the length of the activity, only about 50 per cent of the person under one year of age is owned; about 60 per cent of the person under one to three years of age, and about 70 per cent of the person under three to five years of age, after which the proportion remains unchanged. In terms of sexual orientation, 80 per cent of bisexuals have electric massage machines, while heterosexuals own about 50 per cent.
Figure 198: Availability of electric massage machines for participants
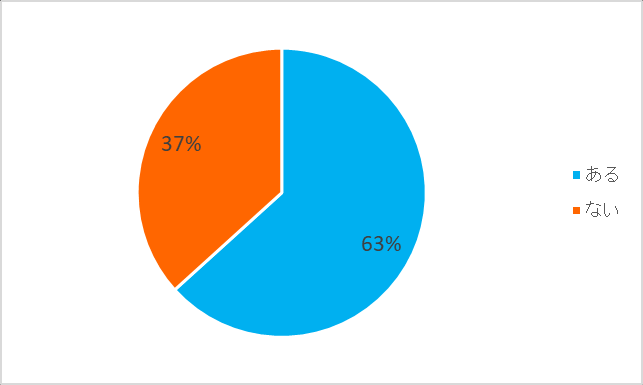 Figure 199: Possession of electric massage parlours by sexual excitation of kigurumi
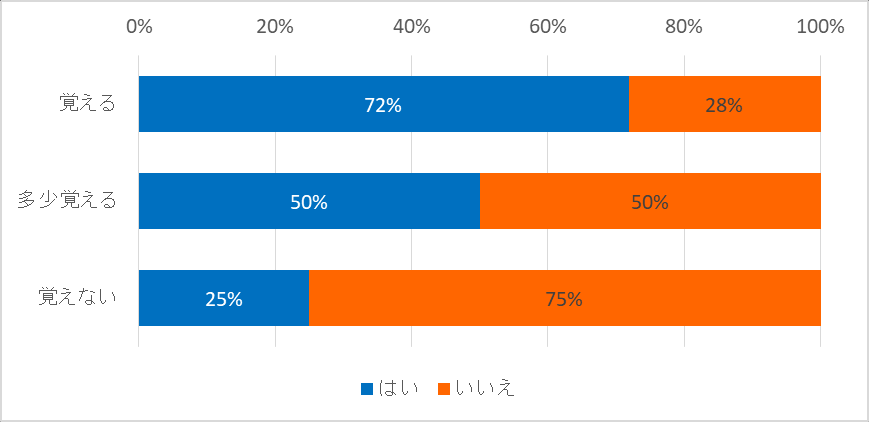
Do you want kigurumi to come or do you want to be kigurumi to come?
Figure 200 shows the intention of 139 inside performer valid respondents to “chosen to be kigurumi or kigurumi's orgasm”. 42% of the answers were “wanted to be kigurumi brought to climax”. “I prefer to be kigurumi brought to climax” was 18%; “I prefer to get kigurumi to climax” was 14%; and “I want kigurumi to climacie” was 6%. “Neither is interested or unwilling” is 6 per cent and “neither is experienced” is 14 per cent.
Figure 201 shows the responses to that question by age. The younger the generation, the more they want to be "kigurumi brought to climax." Of those under 25 years of age, 83 per cent are “wanted to be kigurumi brought to climax” and “more inclined to be kigurumi brought to climax”. Of those over 40 years of age, 47 per cent were “wanted to be kigurumi to come” and 34 per cent were “wanted to be kigurumi to come” and “wanted to kigurumi to come”.
Figure 200: Performer's intent to "go Kigurumi or be kigurumi brought to climax"
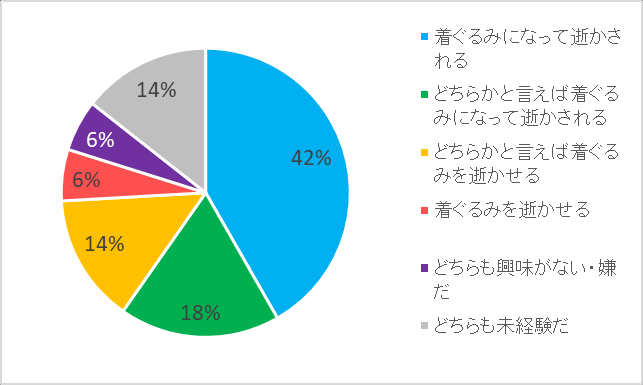 Figure 201: Intent of age “to get kigurumi to orgasm or to get kigurumi to orgasm”
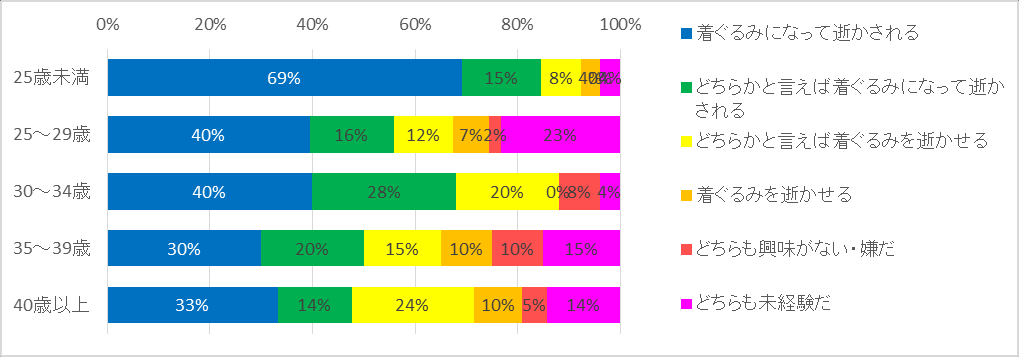
58. Like/do not like to judge the kigurumi elements
Figure 202 summarizes the preferences/disappearances of more than 210 effective respondents with regard to the kigurumi-related philosophies. “I like” “I like more” projects totalling more than 50 per cent, to a lesser extent, as follows: “Smuggle”, 78 per cent; “肌タイ/wrinkle”, 74 per cent; “respiration”, 70 per cent; “repressive/rubber”, 67 per cent; “drum up”, 58 per cent; “bound” 56 per cent; “TSF” (Trans Sexual Fantasy, “Creativation type”) 56 per cent; “sweed”, 54 per cent; “confining others”, 54 per cent; and “leaking” 52 per cent.
Here, to exclude the answer of “not known/not experienced”, the word “like” is recorded as 4 points, the word “like” as 3 points, the word “not liked” as 2 points, the word “not liked” as 1 points, and the average of the respondent is calculated and used for comparison. The average share is shown in table 16. The highest average score was 3.44. The second is “肌タイ/wrinkle” at 3.30, “respiration” at 3.14.
Figure 203 shows the average score by whether kigurumi is sexually excited. In all projects, those who “create” kigurumi's sexual excitement give a higher average score than those who “does not produce much”. However, “肌タイ/wrinkle” is supported at all levels.
Figure 204 shows the average score by whether or not kigurumi is proud. In general, in almost all projects, the “with pride” level gives a higher average. In particular, pride is shown by the “female mask” of “squeezing/rubber” and “squeezing” “female mask”. On the contrary, the less dependent are more abusive elements such as “controlled breathing” “bounded”.
Figure 205 shows the average score by kigurumi area of response. In general, projects give higher averages according to the order of “acts such as adult/love” > “greating” > “pure photo fairs” > “challenges with peers”. Among the items showing exceptional behaviour are: a higher average in terms of “self-cruising”, in terms of choosing “the level of choice with the general population,” than in terms of “adult/love behaviour, etc.”; a lower average in terms of “hot to others”, in terms of “hot to others”, in terms of choosing “pure photo fairs”, and a relatively high average in terms of “lock to others”, in terms of choosing “chatting with peers”.
| Love elements | Average score |
|---|---|
| A perforation. | 2.66 |
| Respiration | 3.14 |
| Sweat. | 2.80 |
| Hada-tai/wrinkle | 3.30 |
| You're so cute. | 3.44 |
| Tightening/rubber | 3.10 |
| Drum | 2.82 |
| Leak | 2.71 |
| Body fluid leak | 2.48 |
| He's a hot-ass. | 2.30 |
| It's hot. | 2.29 |
| Control someone's breathing. | 2.45 |
| It's under control. | 2.34 |
| Locking people. | 2.88 |
| Locked. | 2.89 |
| TSF | 3.09 |
| I'm sorry. | 2.50 |
Table 16: Average score of kigurumi elements
Figure 202: Distribution of respondents ' evaluations of kigurumi
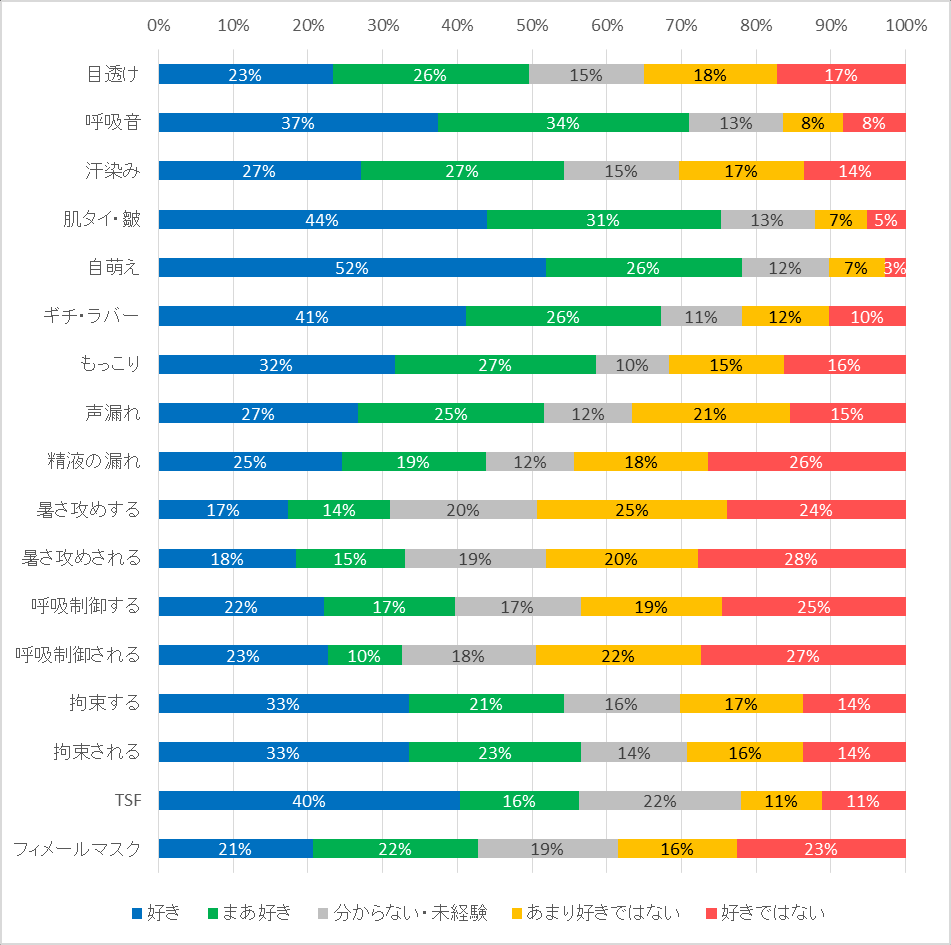 Figure 203: Average score of kigurumi embryos by sexual excitement of kigurumi
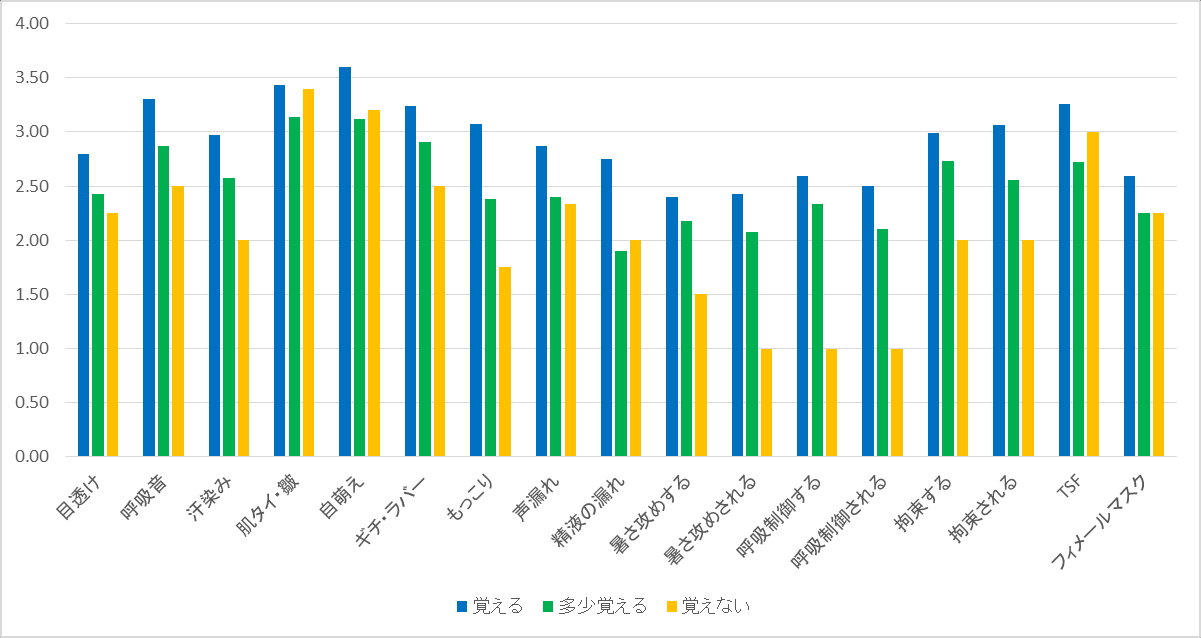 Figure 204: Average score of kigurumi elements by pride in kigurumi preferences
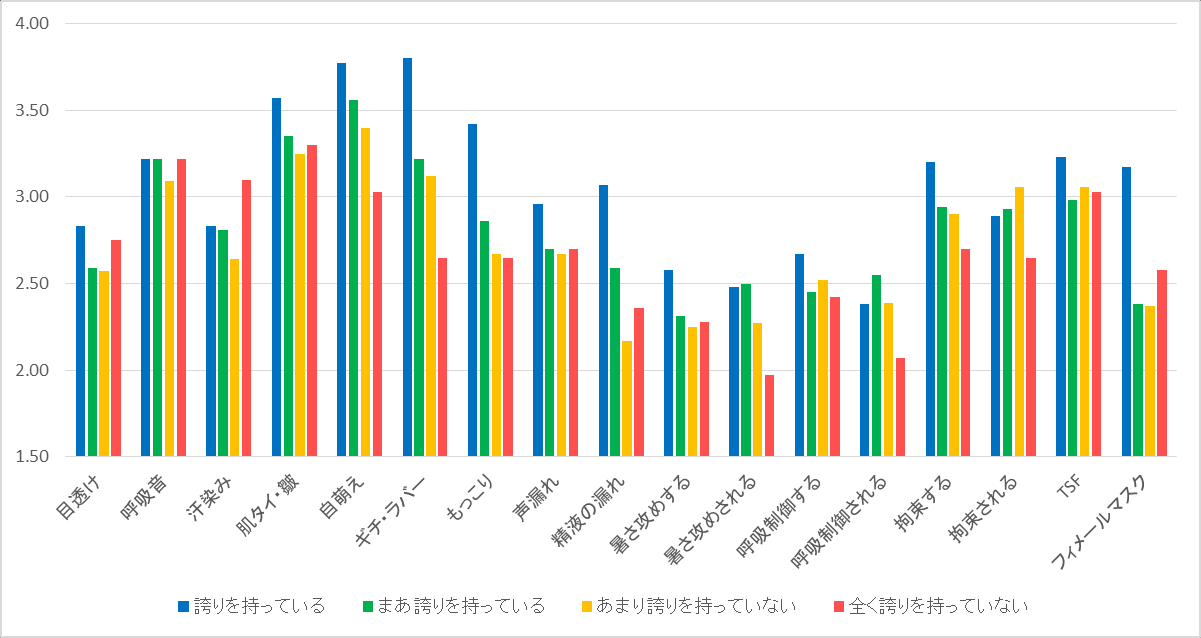 Figure 205: Average score of kigurumi elements by glamourumi field
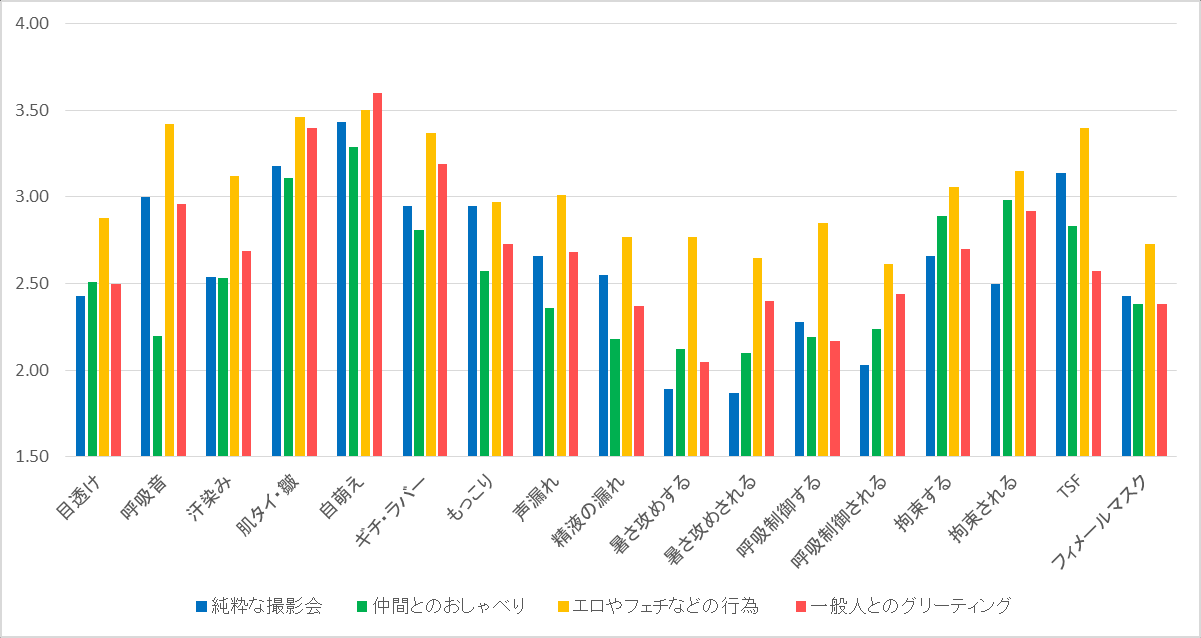
Closing
Over.
Source Record
(@kussy_tessy), Kigurumi Census Results Report Report, October 2017 Survey, PDF, 73.